
This second piece in a series exploring our approach to strategic asset allocation
takes a closer look at the fixed income holdings in portfolios and the important
role of credit.
With yields on government bonds and many investment grade corporate bonds at record lows, it's important to broaden the fixed income universe when constructing portfolios.
Well-diversified exposure to credit, including high yield corporate bonds and emerging market debt, helps to boost expected returns of our strategic asset allocations.
Although there are additional risks associated with these investments, we believe they are adequately compensated by the additional yield they can offer
For decades investors could rely on developed market (DM) government and high-quality corporate bonds to deliver relatively safe and stable returns, while also reducing risk. A portfolio that blended stocks and high-quality fixed income securities usually achieved satisfactory returns – but it’s no longer the case.
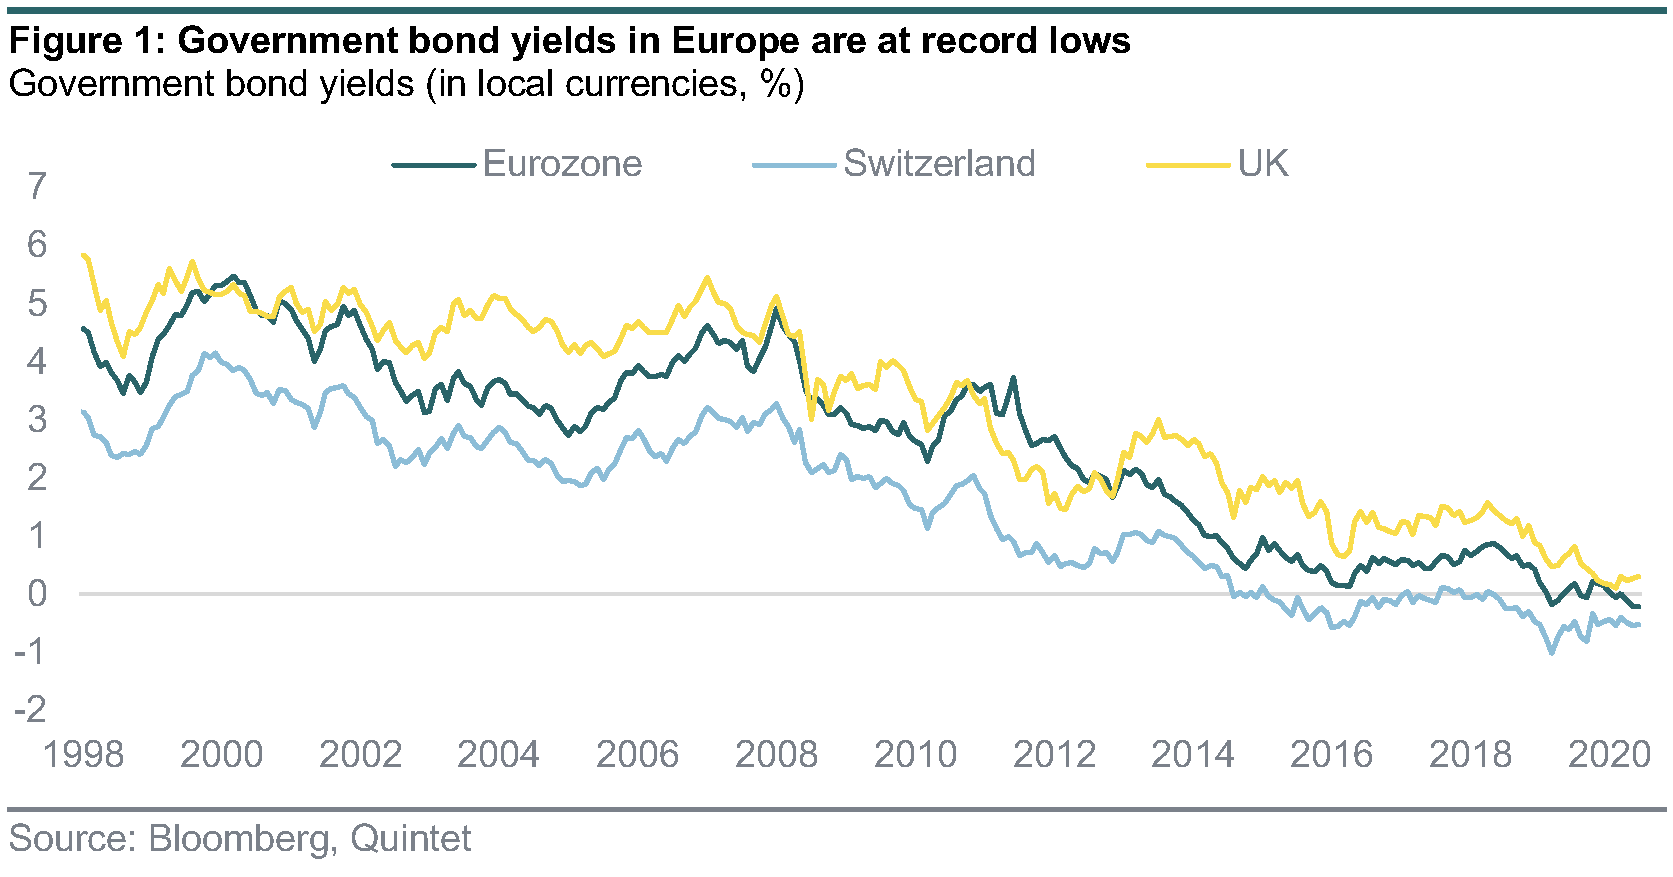
Government bond yields throughout the developed world are close to their record lows (figure 1), and half of the high-quality bond universe (those with a credit rating of AA or higher) trades with a negative yield. That leaves the asset class with a poor long-term return outlook. We estimate that government bonds in euros and Swiss francs will deliver total returns close to zero over the next 10 years, and underperform cash in all our four major currencies.
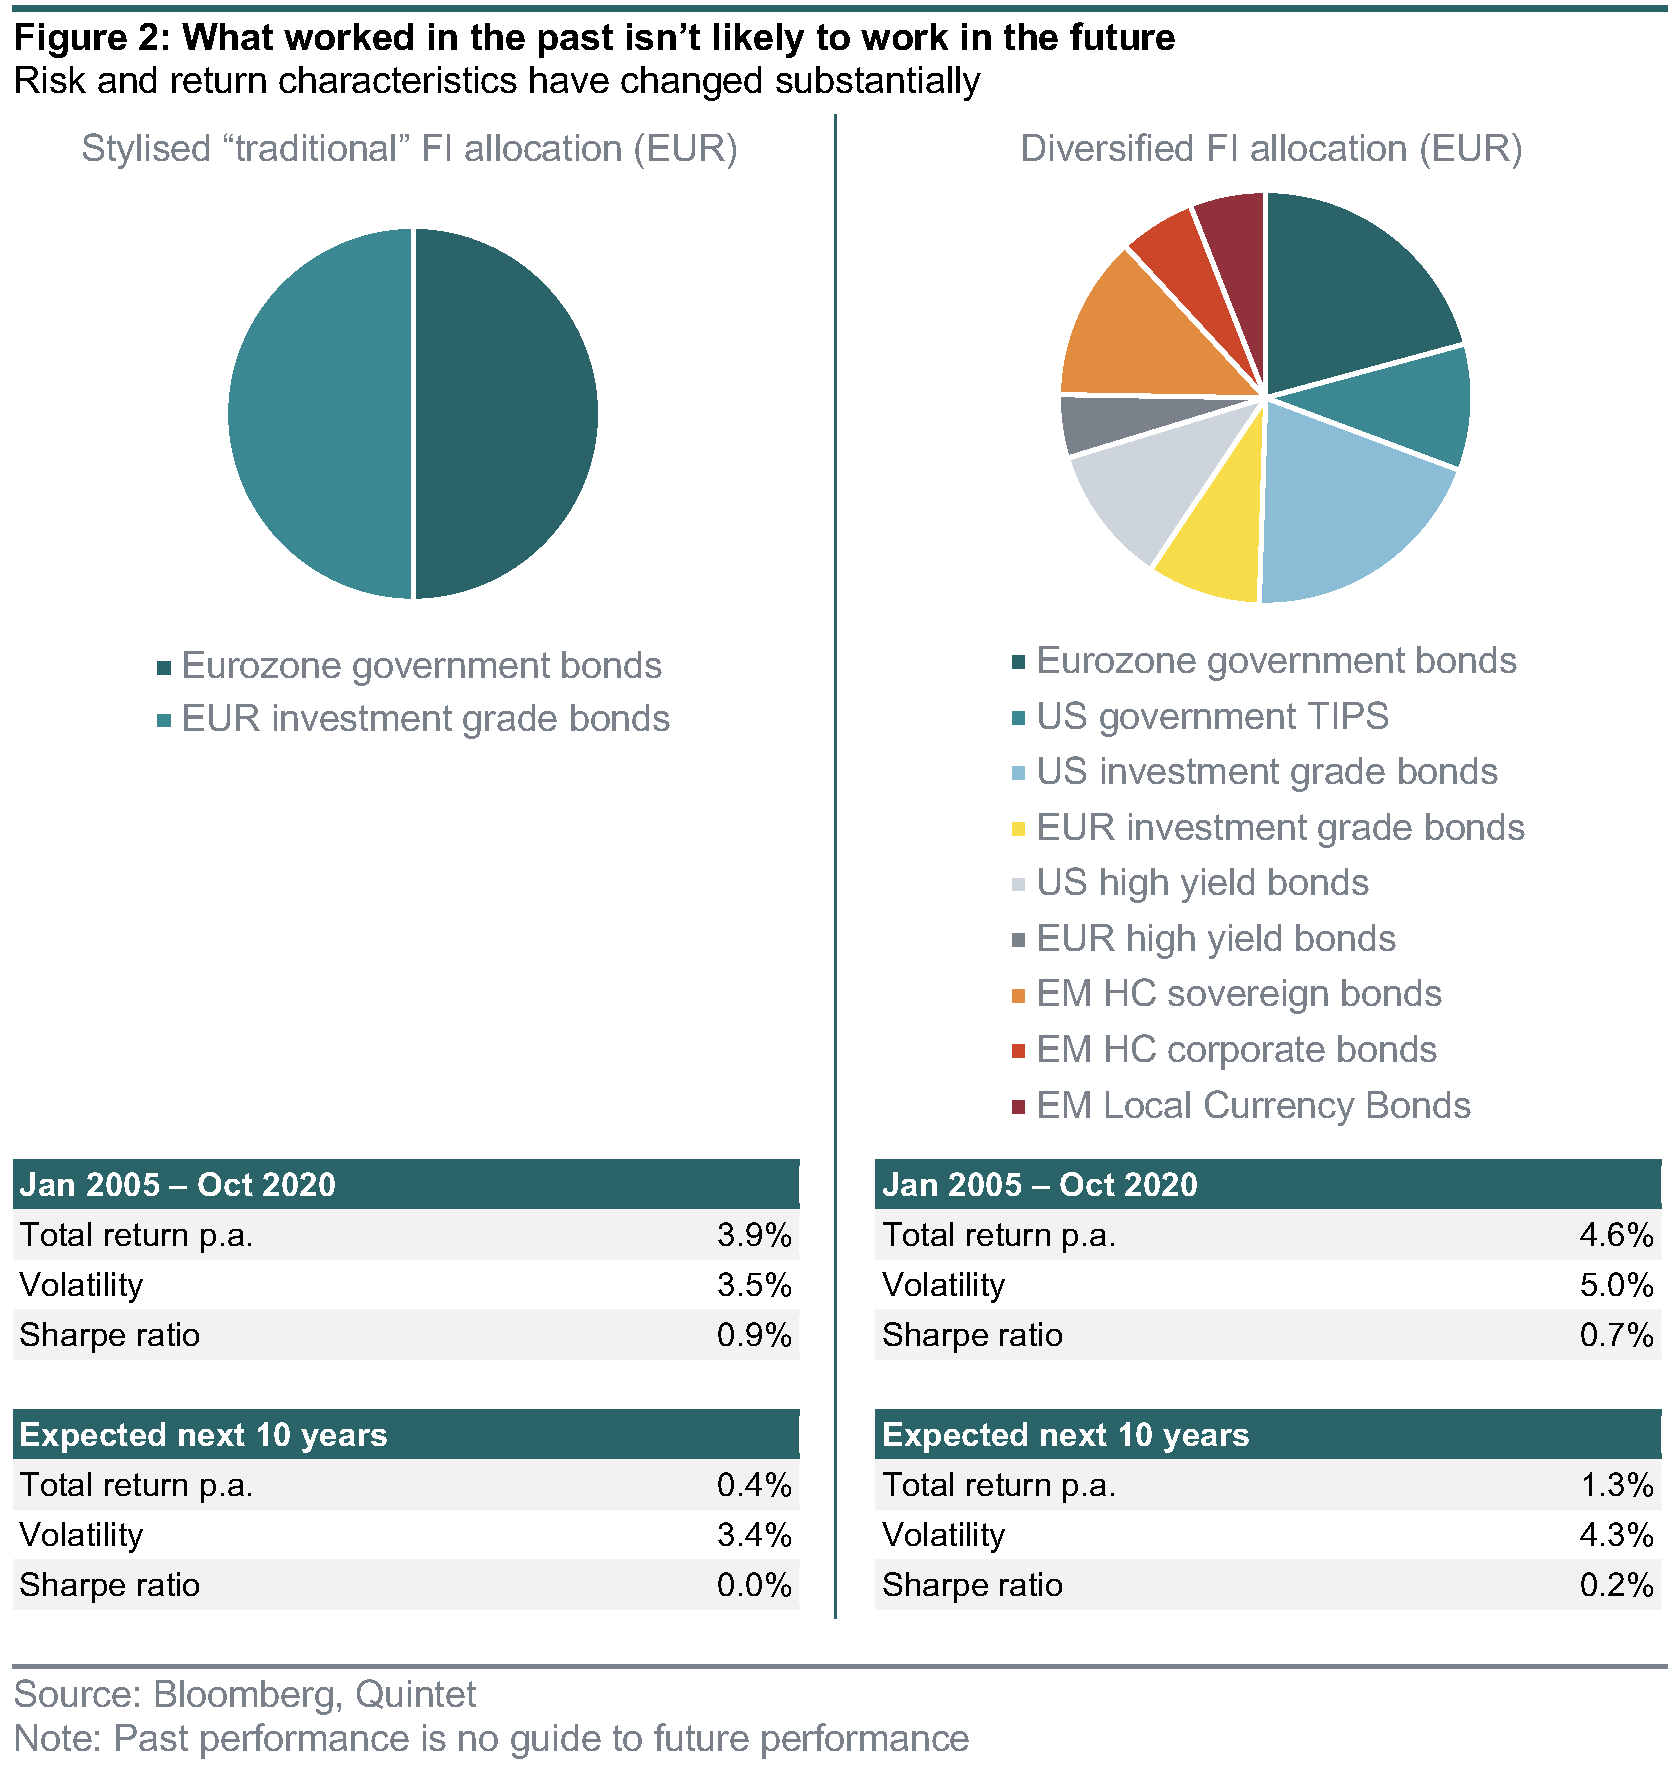
Low or negative yields don’t just limit expected returns; they also translate into higher risks. When. yields eventually rise, dragging down bond prices, the low starting point means there’s only a waferthin buffer against negative returns. That means the risk and return characteristics of one of the most important asset classes for portfolio construction have changed substantially, presenting possibly the biggest challenge for strategic asset allocation today (figure 2).
Broaden your horizons
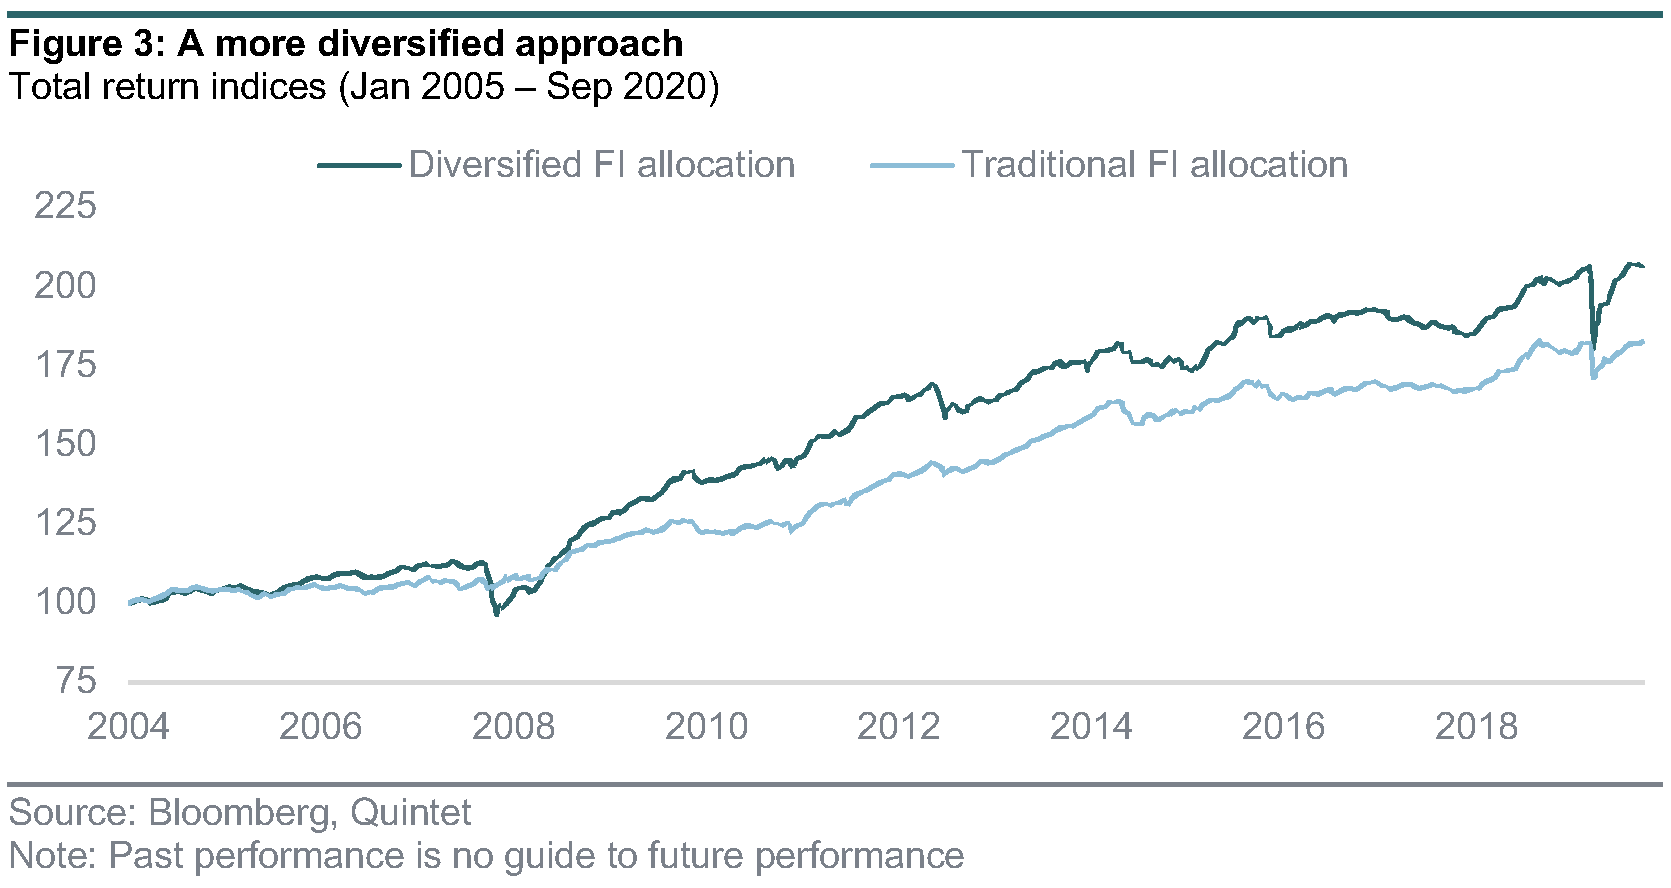
Our solution to this challenge is to broaden the fixed income investment universe beyond highquality bonds and include credit. As figure 3 shows, a diversified allocation has the potential to deliver significantly better returns than a traditional portfolio, which has an expected average return similar to cash over the next 10 years.
As almost always when investing, these additional returns don’t come for free. An allocation to credit comes with higher credit and liquidity risks than high-quality bonds. These risks are well compensated for by the additional expected yield (known as credit spreads) and are incorporated into our risk and return expectations.
Including global, well-diversified credit improves the expected risk-adjusted returns of our strategic asset allocations (SAAs). It also avoids keeping a large part of your portfolio in high-quality bonds (or even cash), which will probably deliver negative real returns over the next 10 years.
Our new SAAs comprise a range of credit asset classes. We use the term credit to describe any fixed income security that involves significant credit risk, which is the risk that the issuer might not (or only partially) fulfil its payment obligations. That’s in contrast to highly rated sovereign bonds like US Treasuries, which we consider ‘risk free’. Investors are compensated for credit risk by the risk premium (or credit spread) – a higher yield than for ‘risk free’ bonds.
We differentiate the credit universe along credit quality, region, currency and issuer type (corporate or sovereign) as follows:
DM investment grade (IG). Corporate bonds with a credit rating of BBB- or higher. We include bonds denominated in EUR and USD. The long-term average credit spread of IG bonds is 100 to 150 basis points (bp). Outright defaults happen rarely, and the major credit risk relates to credit rating downgrades, which weigh down the price. Duration (the effect on bond prices of changes in the underlying ‘risk free’ yield) is an important factor too.
DM high yield (HY). Corporate bonds with a credit rating of BB+ or lower, again denominated in EUR or USD. Default risks for HY bonds are substantially higher than for IG and so are credit spreads. The long-term average credit spread of HY is 450– 550bp, compensating well for average long-term credit losses due to defaults of 200–250bp per year (after accounting for recovery values). Historically default rates averaged around 4% for this type of credit.
Emerging markets (EM). Within EM there are three sub-asset classes: EM sovereign bonds and EM corporate bonds denominated in USD as well as EM bonds denominated in local currencies. Debt in USD allows EM issuers to access a large pool of international investors. The underlying risk-free rate is the US Treasury yield. Typically, investors demand a higher credit spread for taking EM risk than for a comparable DM issuer with a similar credit rating. EM bonds issued in the respective local currency provide an additional source of risk and return besides duration and credit risk, as investors are exposed to EM exchange rate fluctuations.
Why credit is not ‘too risky’
Our analysis shows the long-term attractiveness of including credit in your portfolio. In particular, we find that the additional risks are well compensated for and manageable. That’s especially true as we follow two key concepts when building our SAAs: diversification (including many different subasset classes within our fixed income allocation) and investing with a long time horizon (we design our SAAs with a 10-year investment horizon).
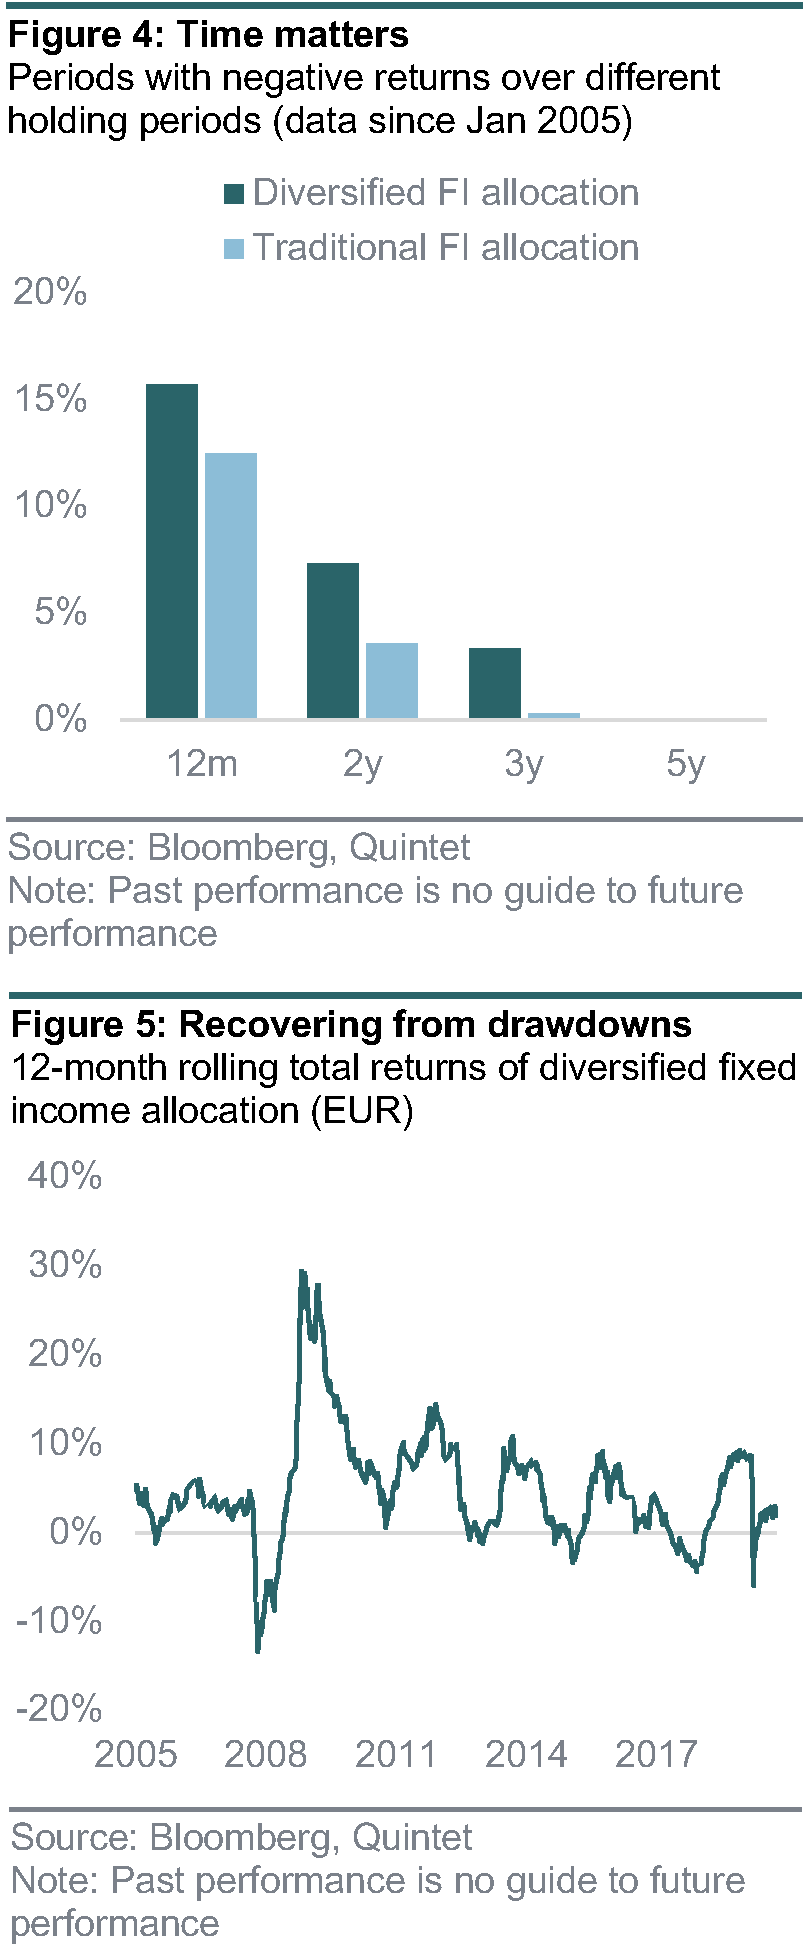
As figure 4 shows, over shorter holding periods the likelihood of negative total returns for our diversified fixed income portfolio is somewhat higher than for a pure government/IG portfolio. But over five years, the likelihood of suffering losses converges to zero for both (based on data since 2005).
Figure 5 shows the rolling annual returns of the diversified fixed income allocation. The worst 12-month drawdown was 13.5%, which would have happened during the global financial crisis. But just nine months later the allocation would have fully recovered the loss. In March 2020 the 12-month drawdown was 6% with a full recovery after just five months. Such large credit drawdowns happen rarely and – more importantly – there has always been a fast recovery.
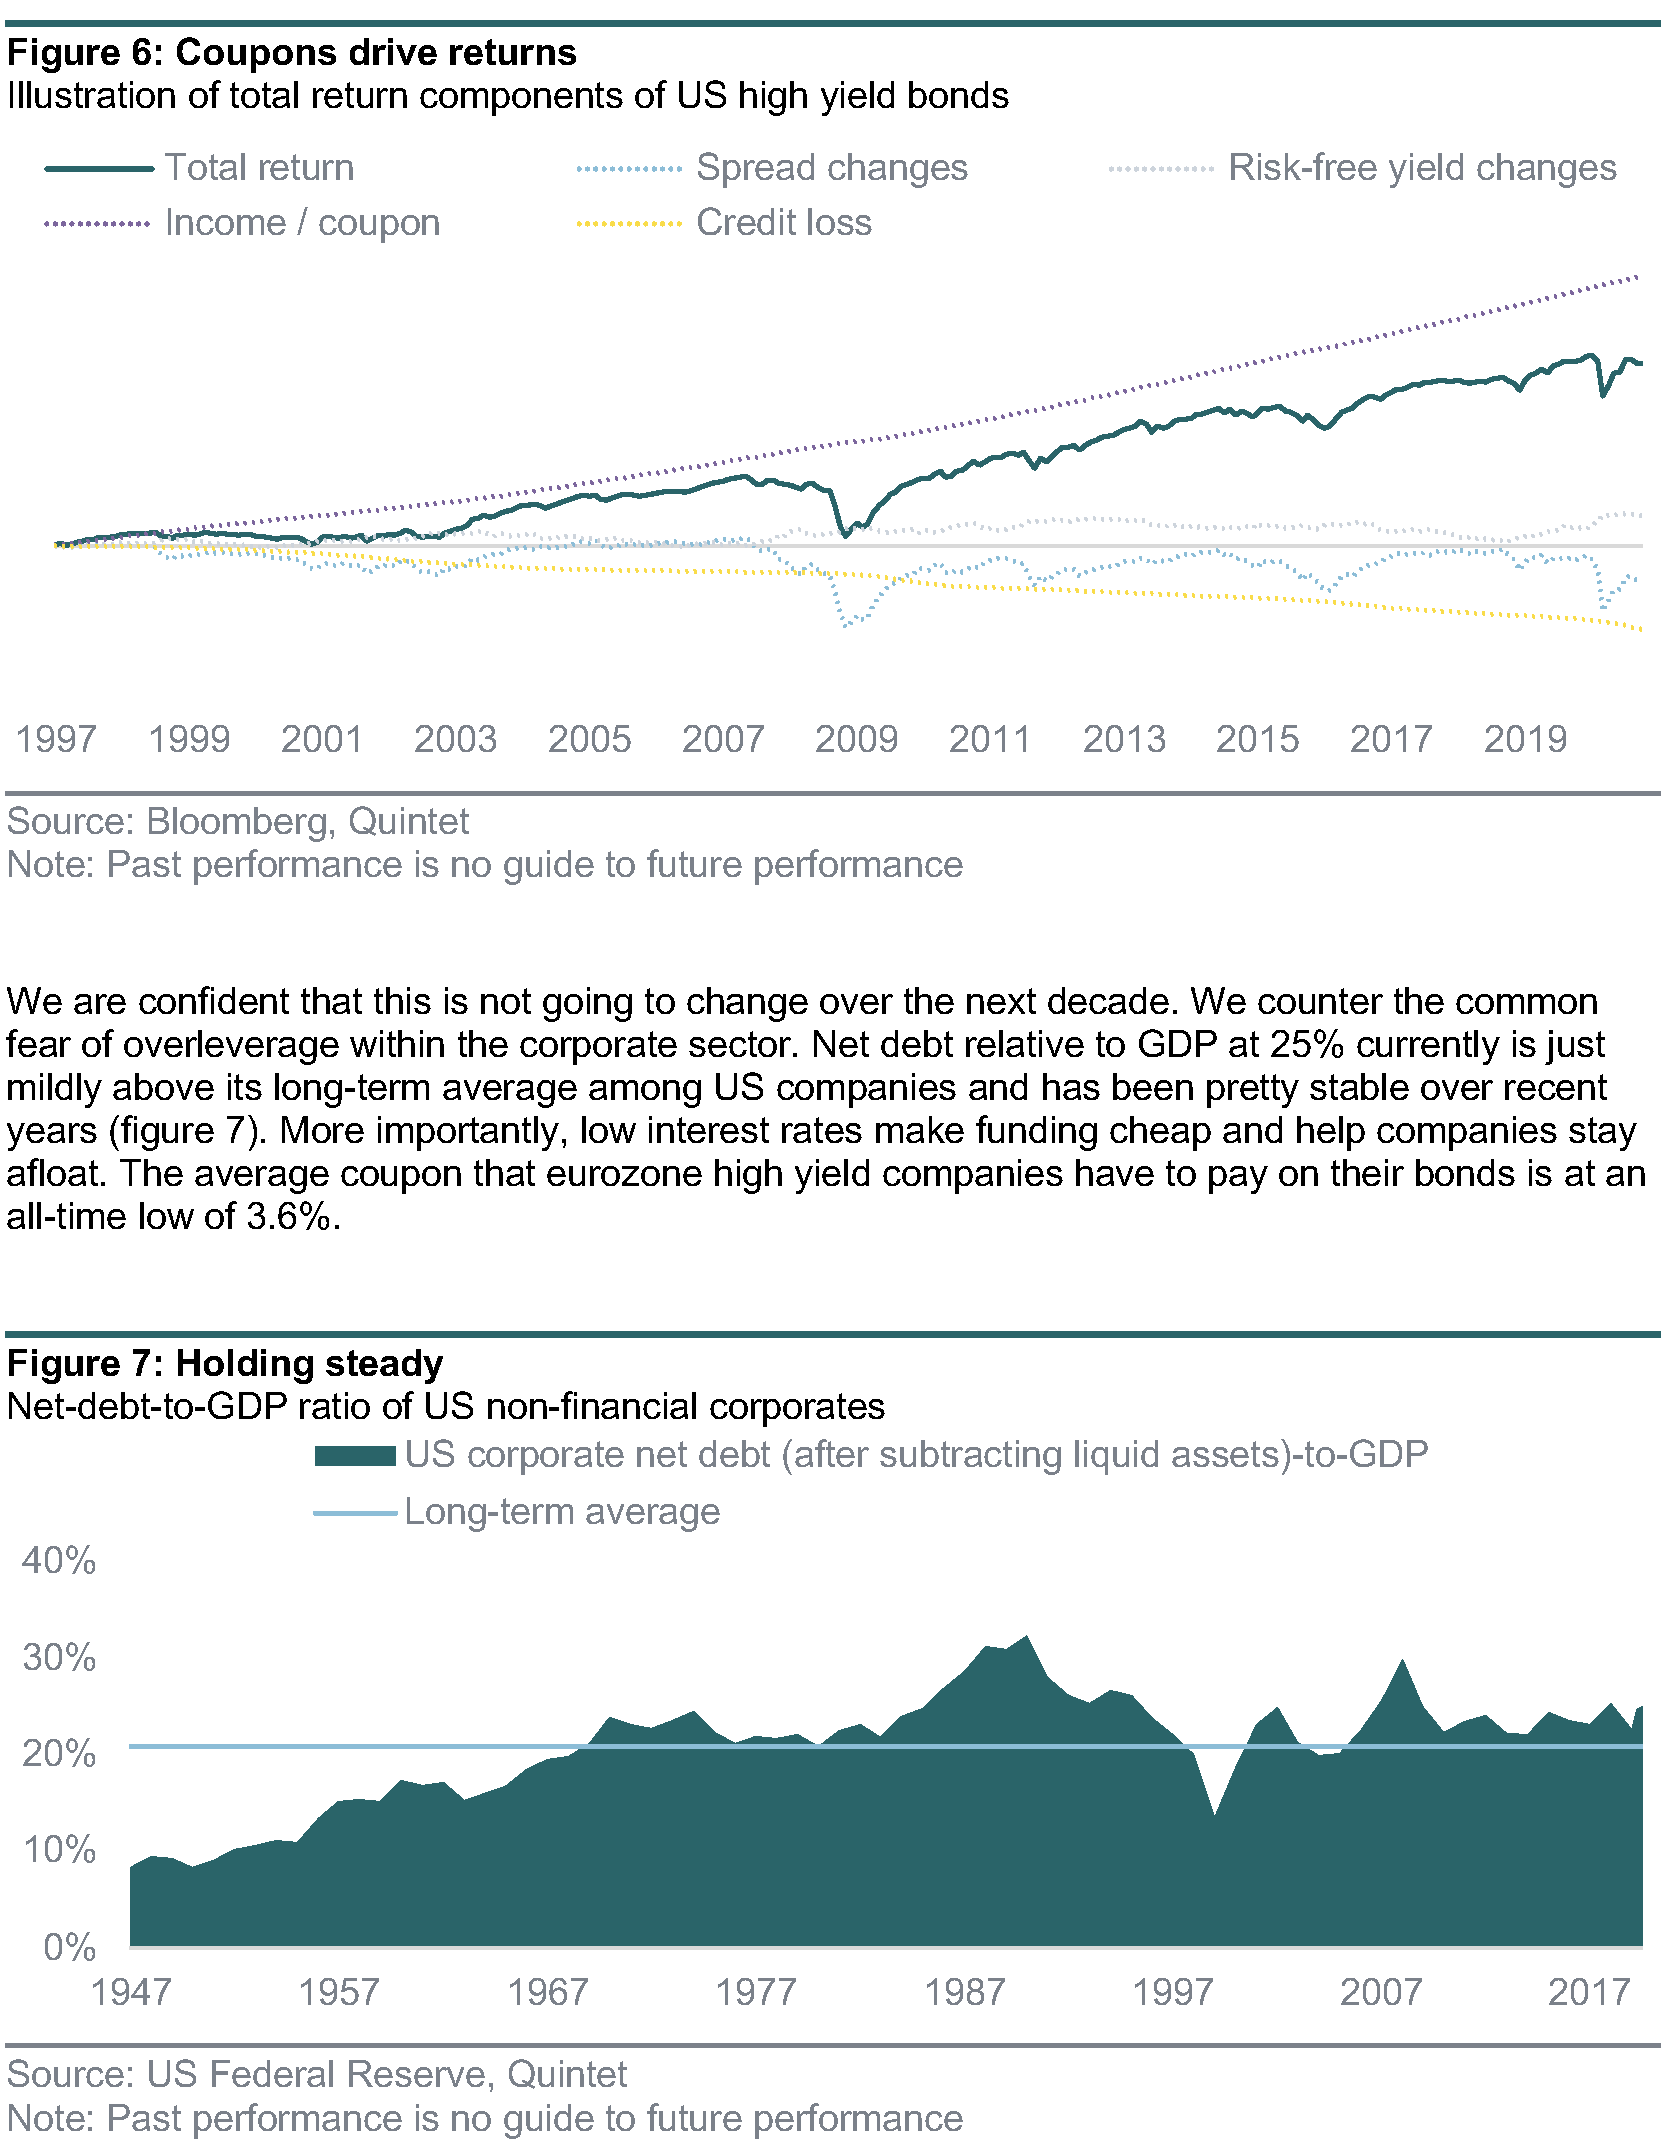
Over a long holding period the total return of even the riskiest credit sub-asset class is driven by the coupon income, as figure 6 shows using US high yield as an example. Default losses subtract from the result and spread changes add shorter-term volatility. But ultimately income is the main determinant, making the asset class relatively predictable.
We are confident that this is not going to change over the next decade. We counter the common fear of overleverage within the corporate sector. Net debt relative to GDP at 25% currently is just mildly above its long-term average among US companies and has been pretty stable over recent years (figure 7). More importantly, low interest rates make funding cheap and help companies stay afloat. The average coupon that eurozone high yield companies have to pay on their bonds is at an all-time low of 3.6%.
Lastly, liquidity risk (the risk of not being able to sell a security at a reasonable price when you want to) is higher for credit than for government bonds. While it’s good to keep in mind that credit markets can become temporarily illiquid in periods of market stress, these periods are short-lived. Therefore, for a strategic investment horizon liquidity considerations play only a minor role.
Why keep government bonds in the SAAs at all?
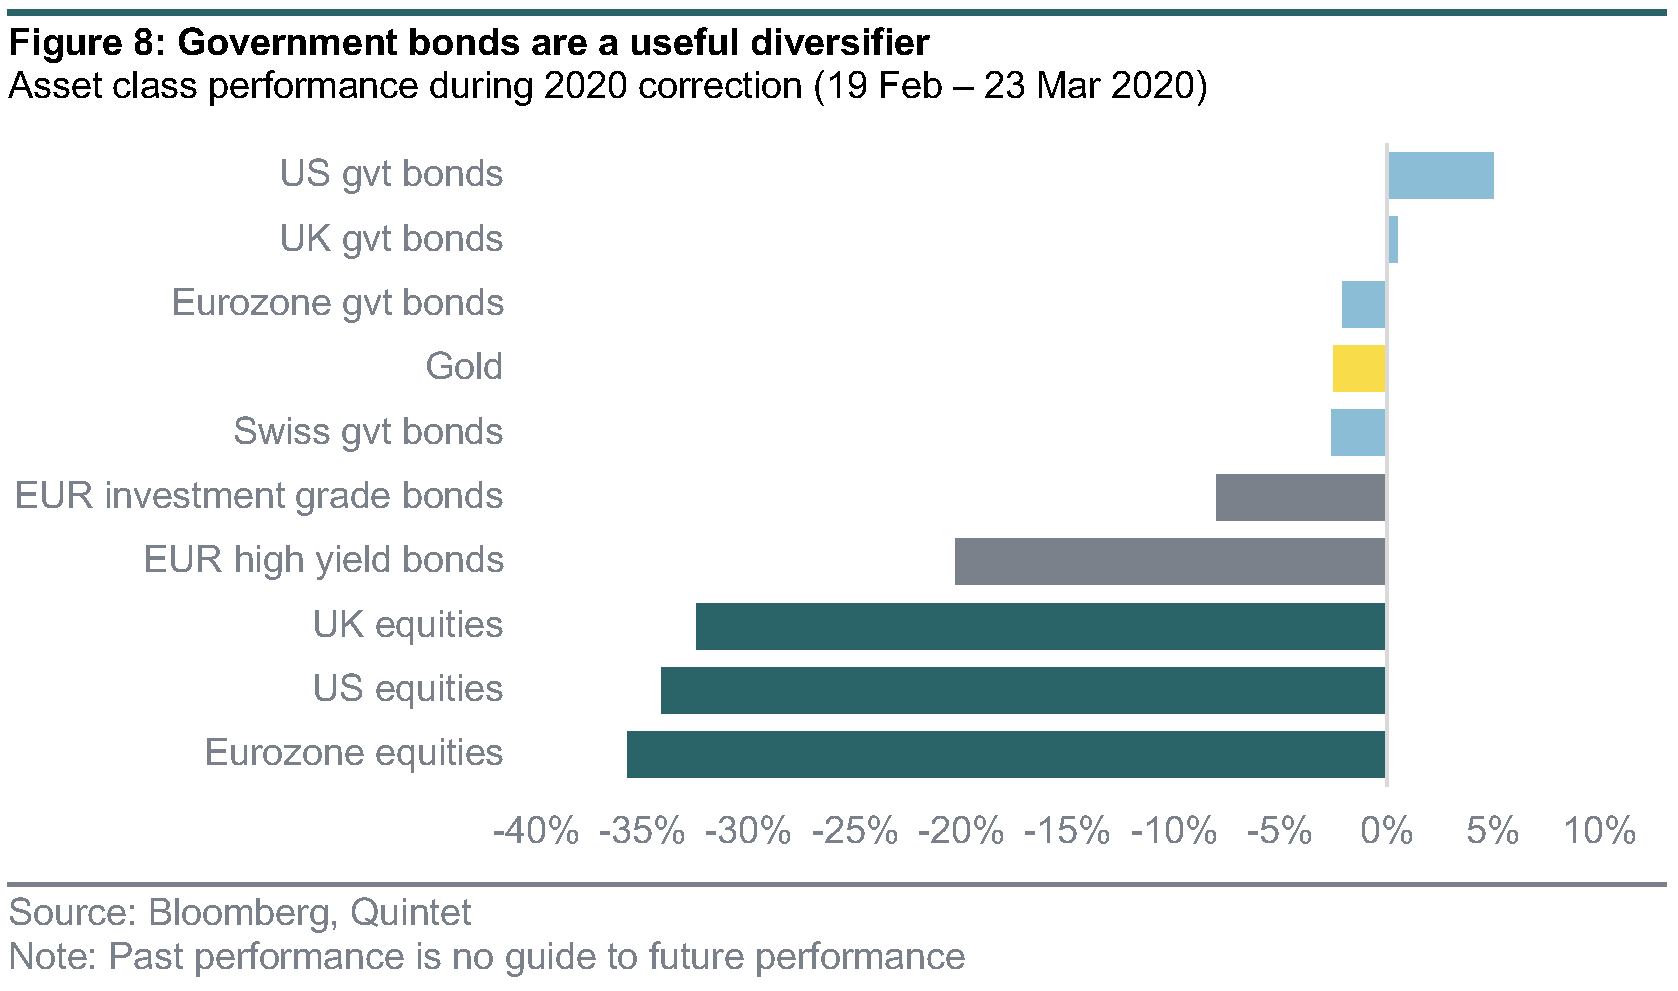
Given the uninspiring outlook for government bonds, you may ask why we still keep an allocation to them in the SAAs at all. Despite low yield levels, government bonds are still one of the few asset classes that usually gain in price when equity prices fall. Thanks to this negative correlation the asset class still serves as a diversifier of risk and mitigates portfolio drawdowns.
The correction of March 2020 is a good example, while it also shows that very low yield levels limit diversification benefits especially among European government bonds (figure 8). We expect the negative correlation to hold in the future, but the magnitude of price gains in stress periods will likely be smaller than in the past due to low yield levels.
Conclusion
Our SAAs have a well-diversified allocation across different fixed income asset classes, including both credit and government bonds, which offers the potential for the best risk-adjusted return characteristic in today’s low-yield environment.
Positive vaccine news has come thick and fast in the last few weeks. After better than expected efficacy data, the UK was the first western country to approve the Pfizer/BioNTech vaccine for distribution, which could begin as soon as 7 December – although it look as if there are some logistical issues with the delivery of the full amount of doses previously planned for the remainder of the year. Now that a vaccine is available, questions invariably turn towards the issue of take-up. We expect the process towards herd immunity to be a gradual one, with health workers, the elderly and very vulnerable segments of the population at the front of the queue.
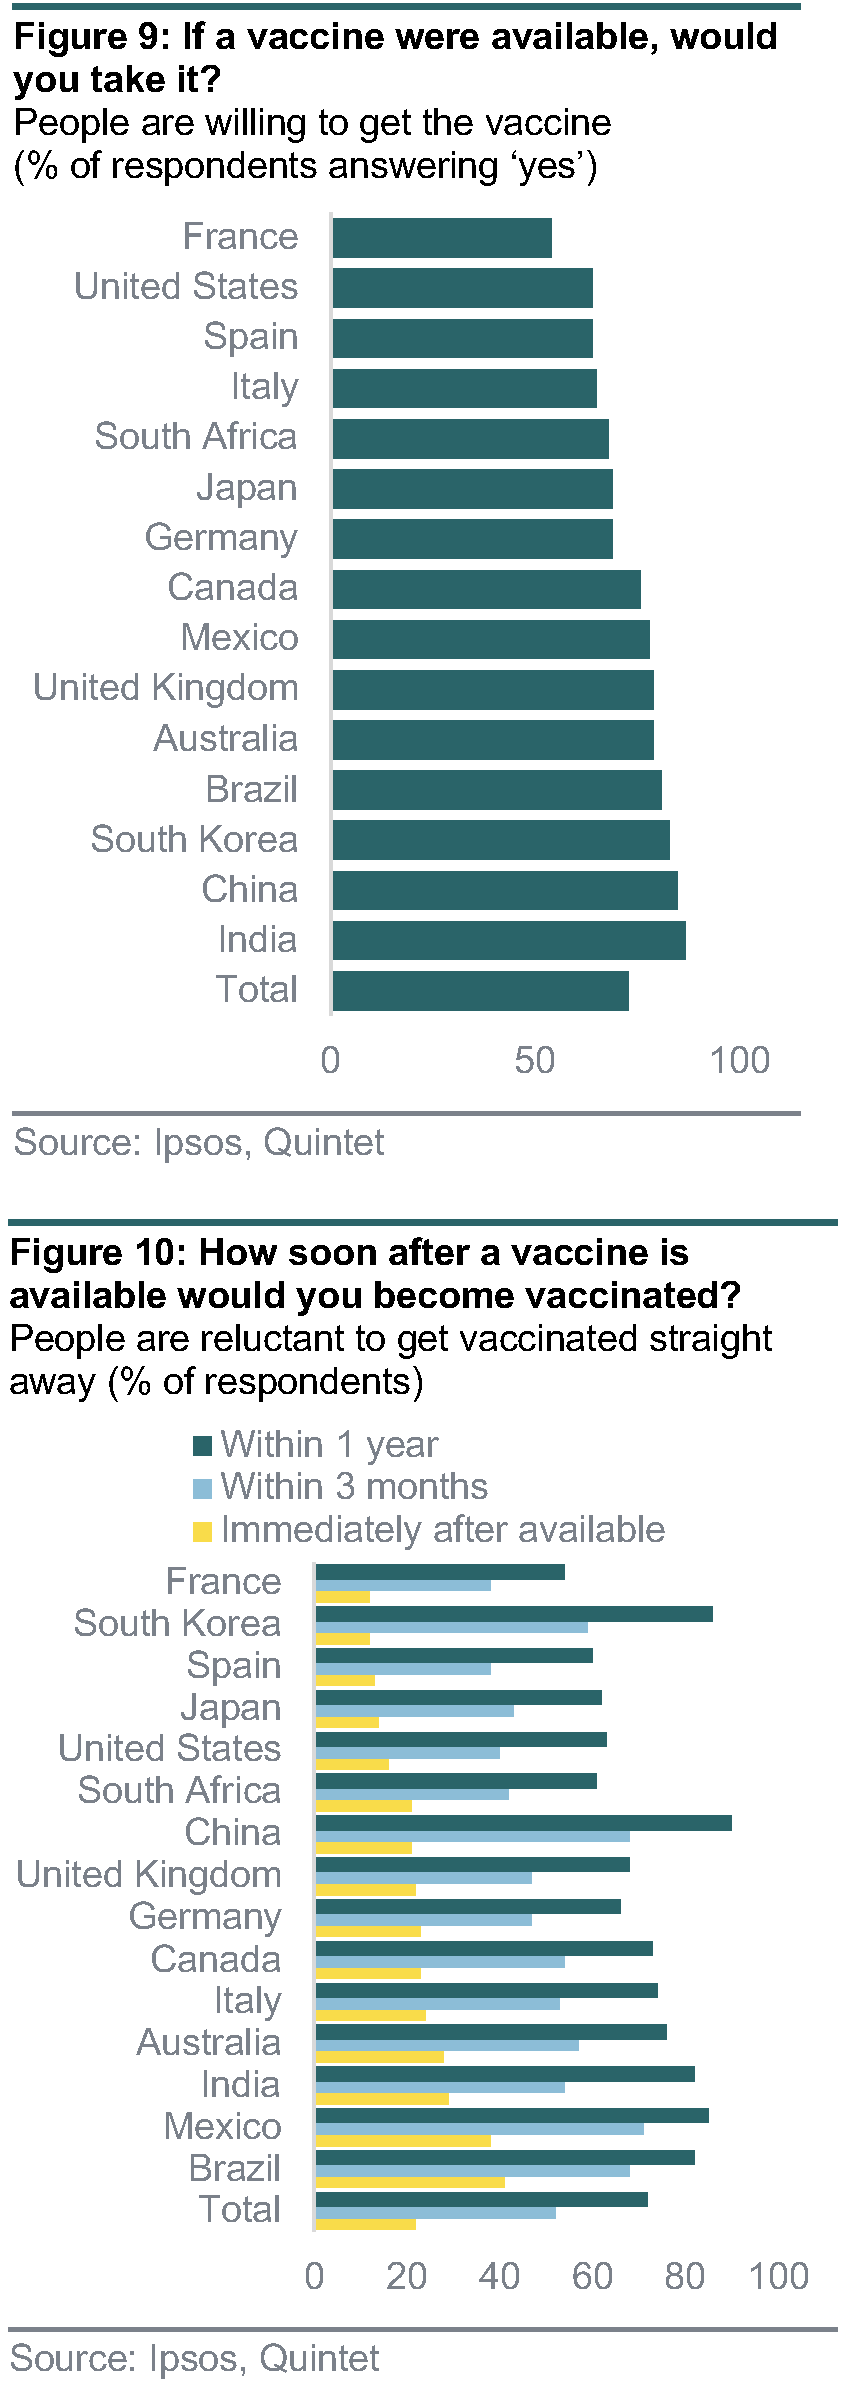
Research by Ipsos shows that, on average, more than 70% of people indicated a willingness to be vaccinated against Covid-19 (figure 9). Furthermore, the survey indicates a certain cautiousness among respondents, with only around 20% willing to be inoculated as soon as the vaccine is approved (figure 10). However, this share increases to above 50% after three months before reaching almost 75% after a year. This is consistent with the tiering system proposed by the US National Association of Medicine which, after high-risk groups in the first quarter, foresees that the immunisation process for the US population should accelerate from April. A similar timeline should,be valid for the UK (given its head start), while we expect Europe and Japan to reach the halfway mark by May or at mid-year.
Take-up rates could be accelerated by governments or service providers requiring proof of vaccination for certain activities. Some airlines, for example, have indicated a willingness to implement a “no vaccine, no flight” rule.
As countries progress towards herd immunisation, economic activities will likely reopen more broadly and permanently this time around, which will form the basis for a rebound in growth starting next spring and accelerating over the summer months.
Daniele Antonucci Chief Economist & Macro Strategist
Carolina Moura-Alves Group Head of Asset Allocation
Philipp Schöttler Cross-Asset Strategist, Group Chief Investment Office
This document has been prepared by Quintet Private Bank (Europe) S.A. The statements and views expressed in this document – based upon information from sources believed to be reliable – are those of Quintet Private Bank (Europe) S.A. as of December 07, 2020, and are subject to change. This document is of a general nature and does not constitute legal, accounting, tax or investment advice. All investors should keep in mind that past performance is no indication of future performance, and that the value of investments may go up or down. Changes in exchange rates may also cause the value of underlying investments to go up or down.
Copyright © Quintet Private Bank (Europe) S.A. 2020. All rights reserved
.svg?ext=.svg)