
FROM DESPAIR TO REPAIR
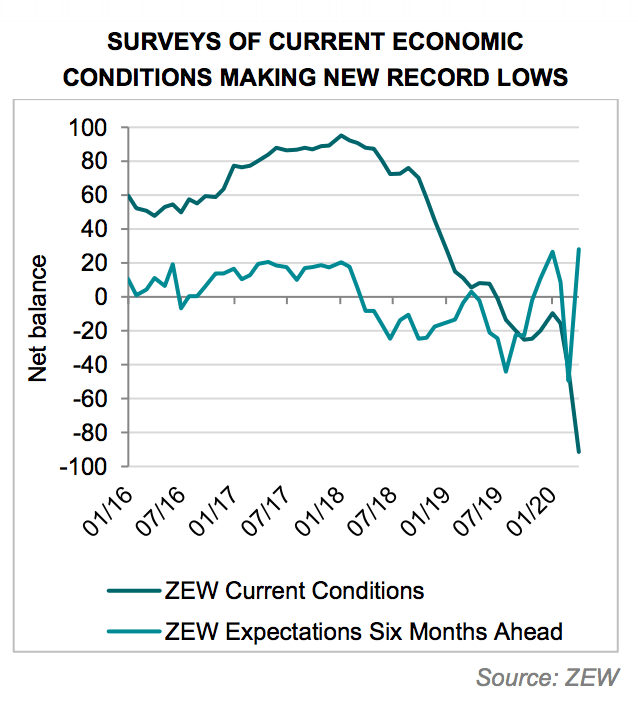
That the ongoing recession is turning out to be the steepest in living memory is not going to surprise anyone by now. A tough earnings season and off-the-chart falls in macro indicators all add to a sense of gloom. That is the Despair phase – the phase we are in right now. What is less obvious is that, as markets are forward-looking, asset prices reflect future developments before they show up in the data. Investors need to think about things that are not yet materialising and begin to position for them before they do. This means thinking about a U-shaped economic path as we transition into the Repair phase. This will be faster where liquidity is the main challenge and slower where solvency is the problem.
THE FIRST-EVER RECESSION BY DECREE
There is no recent precedent and thus no tested playbook for the global recession we are currently going through. Typically, cycles end for two reasons and two reasons only: either the market kills the cycle or the central bank does. The market killing the cycle has to do with financial imbalances that build up and then, inevitably, unwind. Debt crises are like this. The central bank killing the cycle happens when it is concerned that the economy is running too hot, and so it tightens monetary policy to bring inflation back to target.
Things are different this time around, as it is an exogenous shock. The cause of such a sharp contraction is the physical constraints placed on activity because of social distancing, along with the fallout from the health crisis. This means that the duration of the recession and the shape of the recovery will depend on how and when these measures are lifted. If gradually and unevenly across the global economy, then any pick-up is likely be gradual too.
Importantly, despite the record length of the expansion that has just ended, there are no major imbalances in most advanced economies. The balance sheet of the global consumer is healthy. The corporate sector does not look overstretched – with the exception of significant leverage increases in the lower-quality parts of the US credit market. In turn, this implies that there is no need for a prolonged period of deleveraging to correct past excesses.
WHAT IS IN THE PRICE?
All this, while probably a sensible base case, is also the consensus view. The question is what could the market come to expect that is not yet showing up in the dataflow? This is especially important when views on the macro outlook appear one-sided.
Consider this:
Could the economy get worse from here? Could the coronavirus outbreak evolve in an unpredictable way? These remain key downside risks. However, to some extent the economic impact and the uncertainty associated with the health crisis are already in the price. What is not yet in the price is that markets may soon begin to think about themes that are not yet evident in the data.
INFLATION
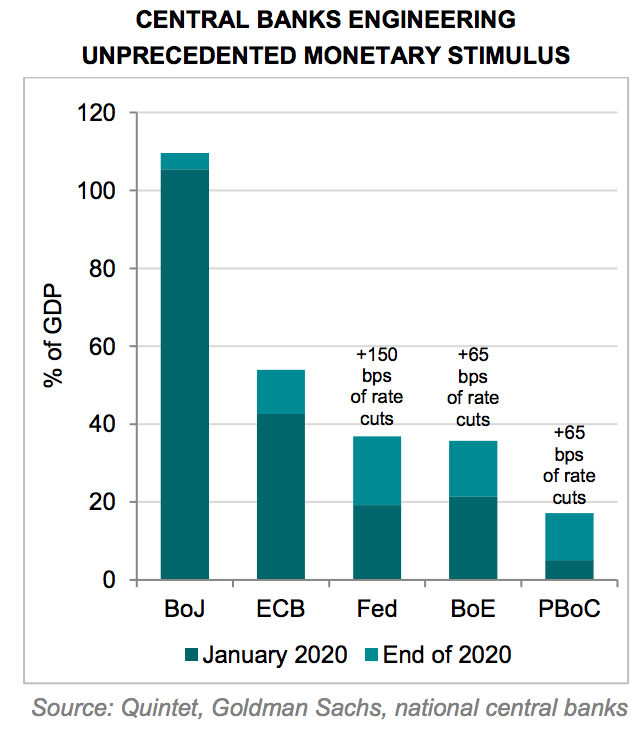
Take inflation. The near-term impact of the health crisis is deflationary, given the amount of spare capacity it has opened up. But a Counterpoint to this is that, further out, inflation may well pick up. The monetary and fiscal policy response to the recession has been extraordinary. It is also different in size and design from what we have seen in past episodes of economic stimulus. What is going on in the US is a good example. The new quantitative easing (QE) programme is much bigger than the one implemented during the financial crisis. And it is going directly into the credit markets.
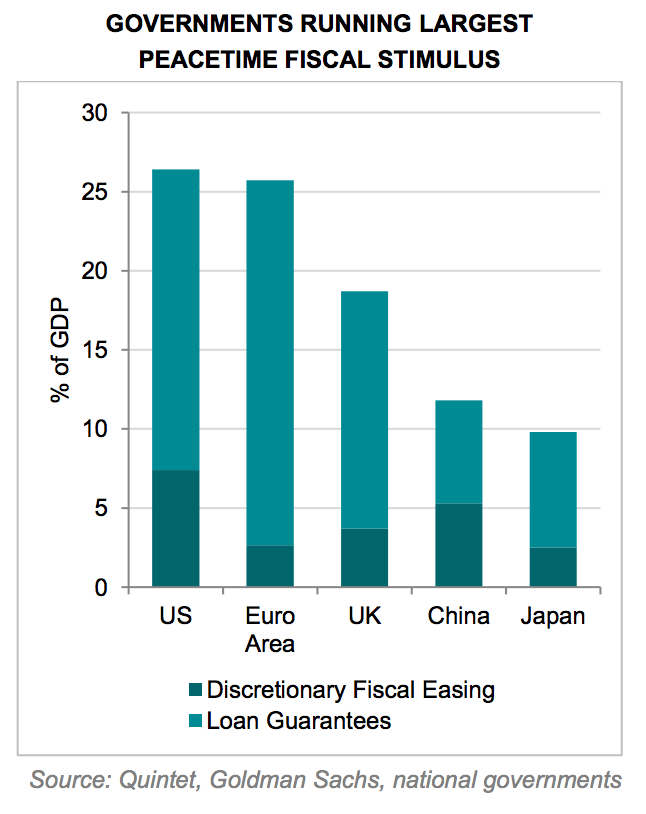
Meanwhile, the quantity and quality of fiscal stimulus from Congress has also been greater this time around. This is because we are in a health crisis in which there is no moral hazard. There are no perceived ‘bad actors’ such as the banking system a decade ago, which has gone through a period of re-regulation. It now has a strong balance sheet that could be deployed to support the recovery. Perhaps more importantly, this fiscal stimulus is flowing directly to low and middle-income consumers and small business owners, who are more inclined to spend it. This is very different from the previous large-scale crisis, when it did not meaningfully trickle down to these parts of the economy.
The euro area is another example. During the debt crisis, monetary policy wanted to reflate. Fiscal policy wanted to deflate. They were working against each other. They are now working in the same direction, trying to engineer an economic rebound. In other words, globally, the past 10 years or so did deliver a lot of monetary stimulus, but that was offset by fiscal austerity coupled with bank regulation and deleveraging. That is why the overall policy mix turned out to be deflationary. Today, we are getting monetary and fiscal stimulus plus bank deregulation. That is inflationary.
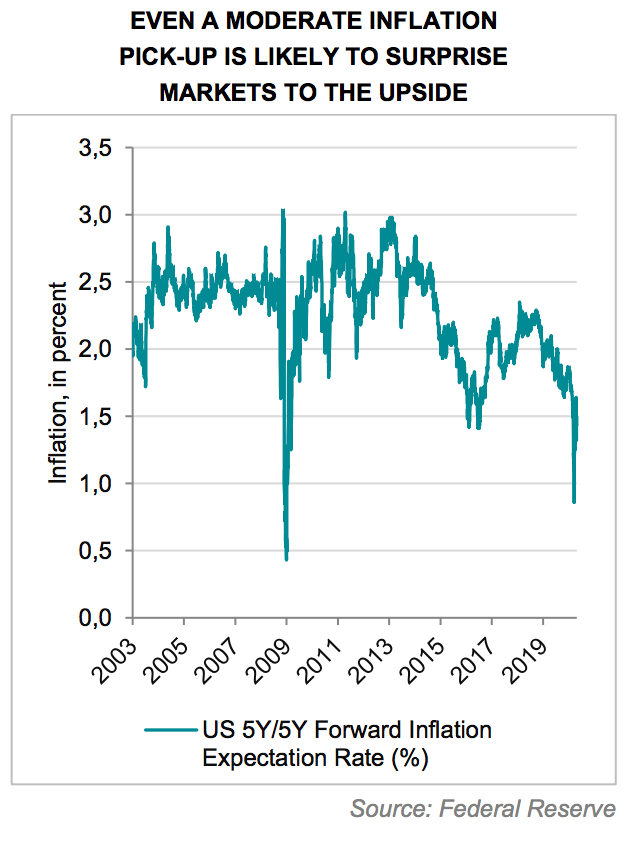
Furthermore, even though there are long-term disinflationary forces at work, such as demographic change and digitalisation, which will likely limit any upturn in inflation, the past couple of years have also seen some potentially underappreciated inflationary developments. Economic populism is leading to wage increases and income support. And economic nationalism is leading to trade tensions and deglobalisation. The health crisis will likely further disrupt and increase the costs associated with running global supply chains. This, when combined with a big fiscal boost which central banks are willing to fund, may put us in a sweet spot where, when we get out of the Despair phase of the crisis and into the Repair one, inflation finally rises gently, without getting out of control. If this scenario occurs, then policymakers will not need to tighten their monetary stance to cool down the economy.
AS A NEW CYCLE BEGINS…
Finally, recessions typically mark the end of bear markets – not the start. So, as the old cycle is ending and investors realise that a new one is beginning, the key question is how to think about relative winners and losers. The important point is to disentangle liquidity challenges from solvency problems. The price of fundamentally good assets being pushed to artificially low levels by investors struggling to raise cash is a problem of liquidity. The market being worried about earnings declining and default rates going up due to weaker growth is a problem of solvency. Central banks are well equipped to ensure that the liquidity taps do not run dry. They find it harder to address concerns about demand and job destruction. As the private sector is shrinking, it is the public sector that has to pick up any slack. However, government action cannot prevent default rates from rising altogether.
So one likely winner is high-quality assets currently trading at reduced valuations, such as defensive stocks and US inflation-linked bonds. Another likely winner is assets leveraged to accelerating growth in the second half of this year and beyond. This includes cyclical stocks that can make it through the recession with liquidity support and, subsequently, benefit from a recovery that, once the virus outbreak is under control and social-distancing measures are lifted, could be robust, given the amount of fiscal and monetary stimulus. Put differently, the economic trajectory may well turn out to be U-shaped, but it is possible that, in some sectors and markets, it could take more of a V-shaped form. Conversely, companies, industries, and countries that are very dependent on trade, tourism, travel, hospitality and entertainment will probably be the relative losers in this environment, as globalisation gets dialled back and leaves their business models, which have already proved vulnerable to trade tensions, more exposed.
COVID-19 WATCH
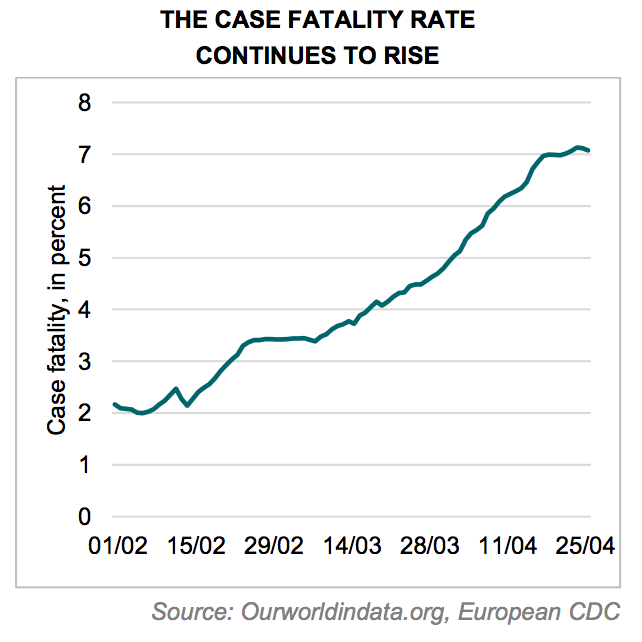
Last week, total deaths attributed to Covid-19 exceeded 200,000, with confirmed cases in excess of 2.85 million. The case fatality rate (deaths / cases) now stands above 7%, having been less than 2.5% at the beginning of February. Does this mean that Covid-19 has become deadlier to those who contract it? The answer is “no”. This is because deaths from Covid-19 lag confirmed Covid-19 cases, because persons who end up dying typically do so several weeks after being diagnosed.
To illustrate the point, we can use a simple model that is populated with dummy data but utilizes the patterns observed in the Covid-19 pandemic. Our model begins with 1,000 new cases per week. Infections accelerate by 1,000 per week until 10,000 new cases per week are recorded in week 10. Thereafter, new cases decline by 1,000 cases a week, and ultimately reach zero. The case fatality rate is set at 10% and deaths lag diagnosis by four weeks.

The model produces interesting observations. First, the peak in weekly deaths occurs after the peak in weekly new cases. Second, the case fatality rate continues to increase, not only after the peak in weekly new cases, but even after the high watermark for weekly deaths.
As investors, this exercise provides valuable insights. We need to be aware that additional bad news, such as a record number of deaths or an increase in the case fatality rate, will likely occur even after the pandemic has passed its peak. This news will typically garner significant press and may influence sentiment. However, as investors, we must be discerning when consuming new Covid-19 data and news headlines.
Bill Street -Group Chief Investment Officer
This document has been prepared by Quintet Private Bank (Europe) S.A. The statements and views expressed in this document – based upon information from sources believed to be reliable – are those of Quintet Private Bank (Europe) S.A. as of April 27, 2019, and are subject to change. This document is of a general nature and does not constitute legal, accounting, tax or investment advice. All investors should keep in mind that past performance is no indication of future performance, and that the value of investments may go up or down. Changes in exchange rates may also cause the value of underlying investments to go up or down. Copyright © Quintet Private Bank (Europe) S.A. 2020. All rights reserved.