


In this latest note focusing on our strategic asset allocation (SAA), we explore our updated risk and return expectations for the next 10 years. What has driven the change in our capital market assumptions (CMAs) and how do they affect investment portfolio
- As part of our SAA process, we update our long-term risk and return expectations once a year. A shift lower in the eurozone government bond curve since last year’s inaugural CMAs is not compensated by higher risk premia and weighs on our return expectations relative to last year, especially for EUR-denominated asset classes.
- After an exceptional year for markets, we expect 10-year returns on our SAAs to remain low, and lower than we estimated last year. We also forecast that average volatility over the same period will be slightly lower than last year’s expectations.
- From a risk-adjusted return perspective, our portfolios remain attractive relative to holding cash. The lower expected returns we now foresee compared to last year do not come at the cost of a lower Sharpe ratio.
Our well-diversified SAAs, built with sustainability in mind, are engineered to provide the best balance of expected returns and risk over the long term. A key pillar in constructing these portfolios are our CMAs – 10-year estimates of future risks, returns and correlations for all asset classes in our SAA universe. As part of our process, we update our CMAs annually.
This year’s CMA update suggests that future expected returns will remain lower than they have been over recent decades. In fact, they are lower than we had forecast a year ago. For EUR- denominated asset classes, the main reason is a shift lower in the eurozone government bond curve although our models suggest additional compression in the risk premia for some asset classes as well. The story is slightly different for the CMAs in some of our other base currencies. Changes in expected returns are more nuanced in GBP and USD.
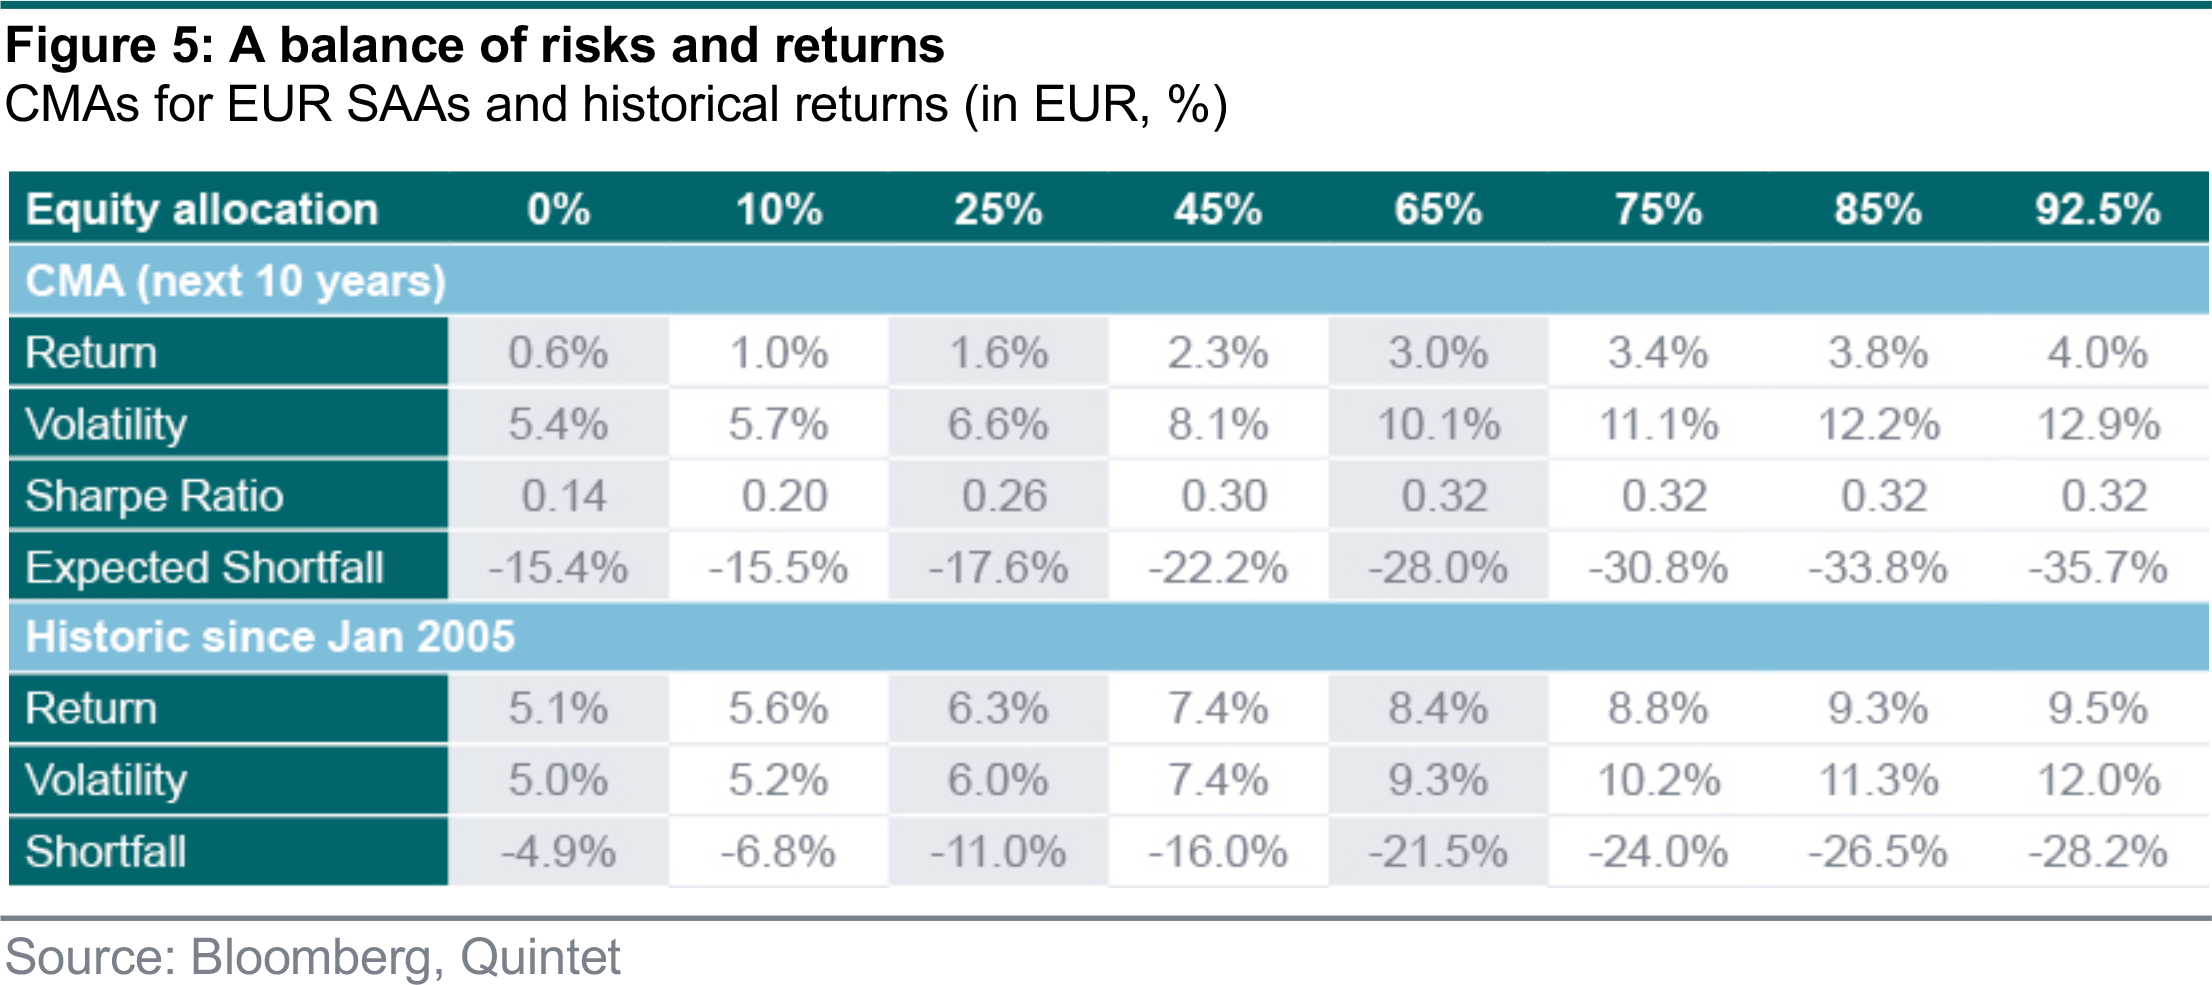
Lower asset class returns mean lower portfolio returns. We now expect a well-balanced EUR SAA with 45% of its allocation in equities to average 2.3% growth per year over the next 10 years. The expected volatility for such a portfolio is 8%, which is also slightly lower than our estimates from a year ago. Importantly, the risk-adjusted returns of our SAAs remain attractive relative to the return on cash. The Sharpe ratio is nearly identical to the level we estimated a year ago. In other words, our core SAA investment strategies continue to offer potential returns that are higher than cash savings.
Financial market projections are difficult but become more reliable when forecasting over a longer time horizon. For instance, since the start of the millennium, global equity returns have ranged from
-42% to +35% in any given year. But over a 10-year horizon, annual returns have averaged between 0% and 9%. That’s why we chose a 10-year period for our projections.
When deriving our CMAs, we try to look at the issue from many angles and use a combination of models that can give us greater confidence in our forecasts. More specifically, when we estimate expected returns, we augment various asset class specific models with a multi-asset factor model.
Individual markets have their own quirks, and so demand their own models. At the same time, by identifying the main driver of returns across our asset class universe, we can narrow the process and ensure consistency across our projections. Combining different models in this way makes for more precise projections.
We update our CMAs once a year. When doing so, we rely on empirical studies, market-implied returns, surveys and expert judgment. Past market performance can be a useful but imperfect guide to future performance, especially when adjusted to account for any structural shifts, such as those caused by sustainable factors.
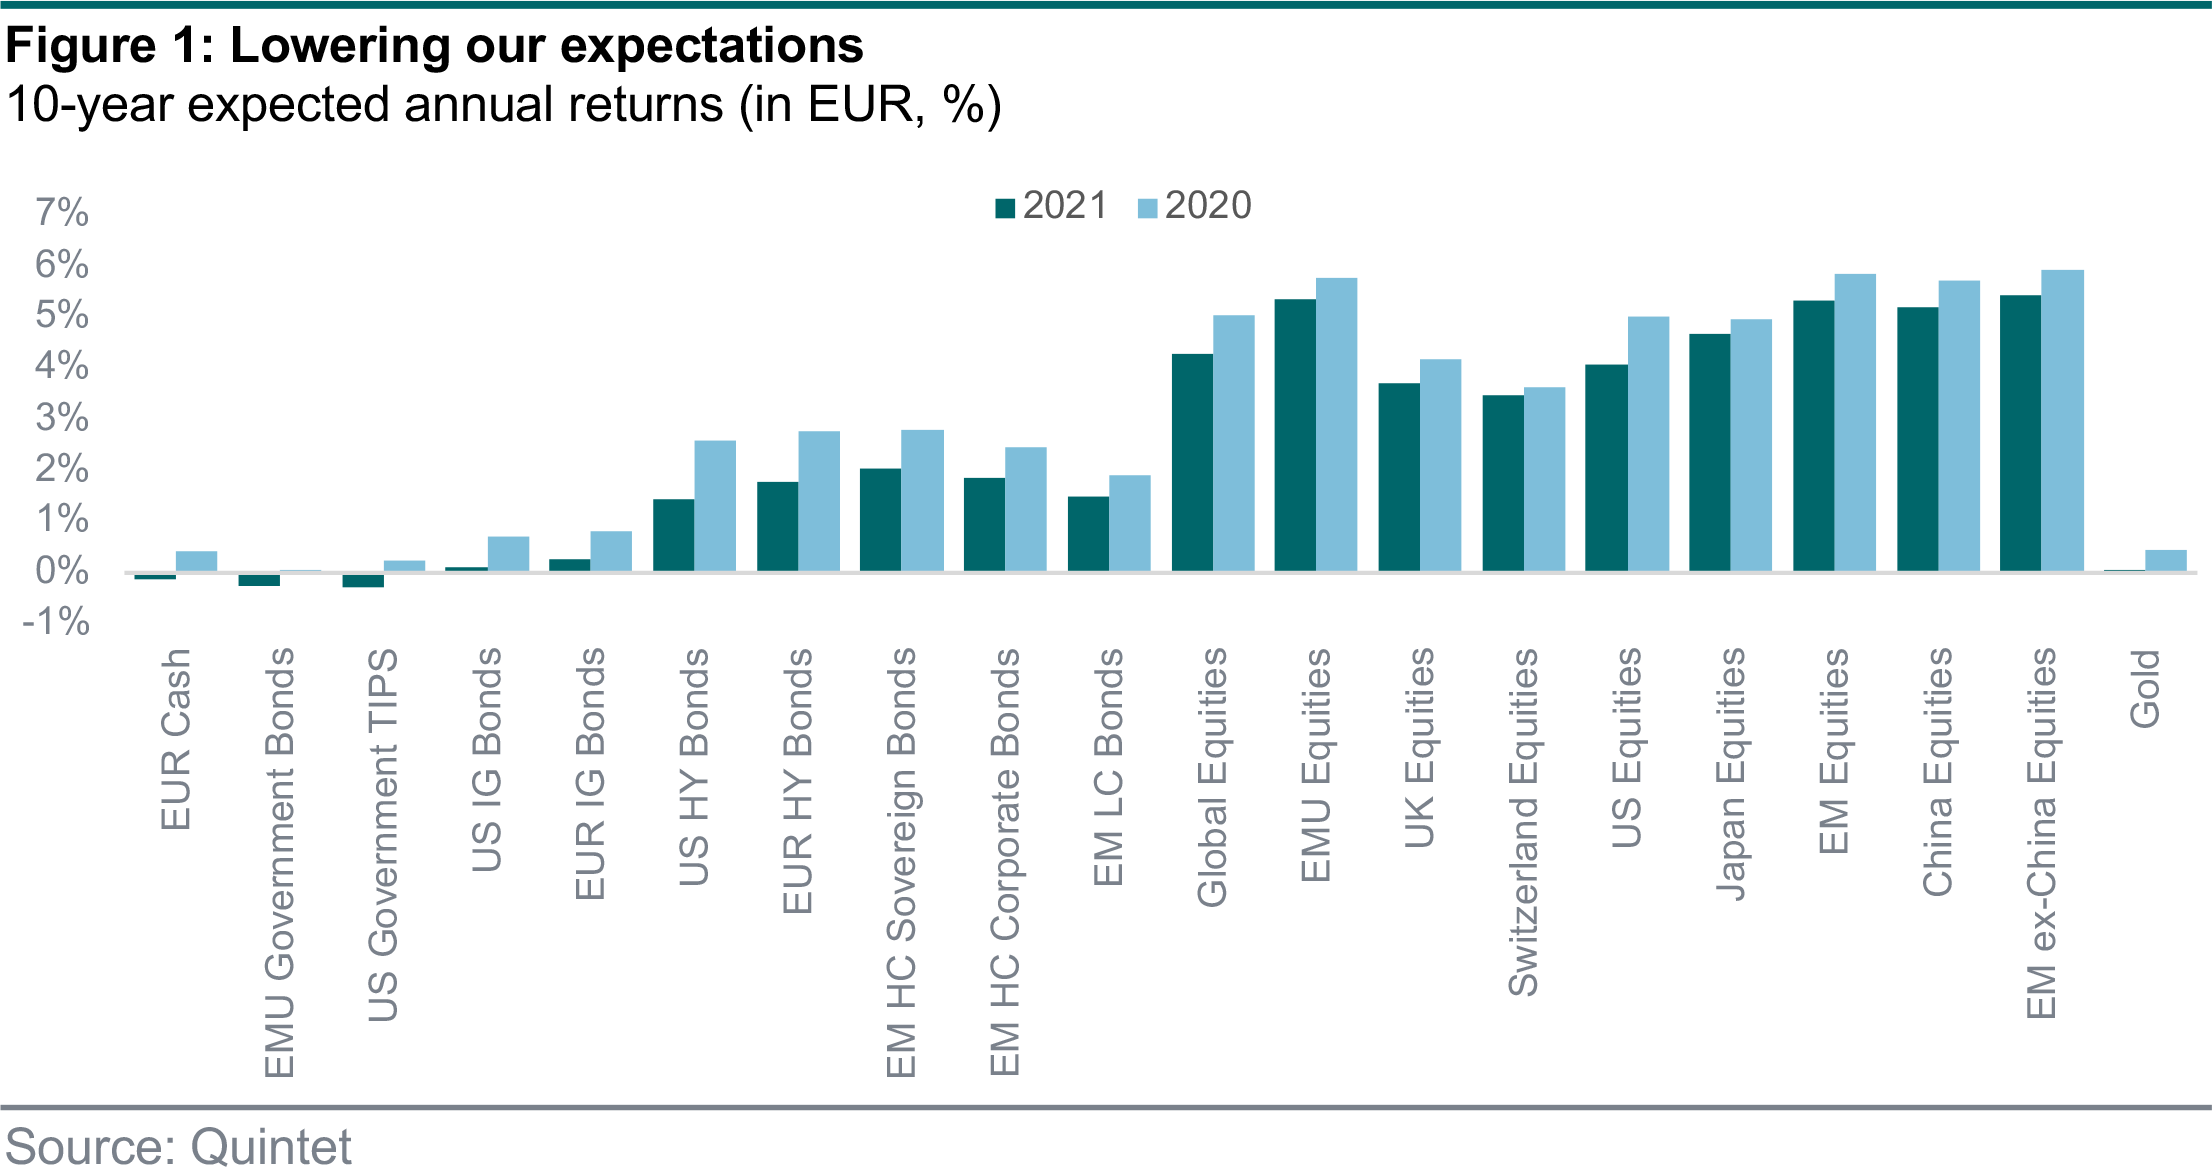
So what are our new CMAs and how have they changed since we introduced them last year? Our expected return assumptions for EUR-based investors are lower than we expected (figure 1). On average across asset classes, we expect annual total returns over the next 10 years to be 50– 60bps lower than a year ago with the largest changes in some of the riskier asset classes such as high yield bonds and some equity regions. For eurozone equities, for instance, we now pencil in a 5.3% return, while EUR-denominated investment grade bonds should deliver 0.1% per annum.
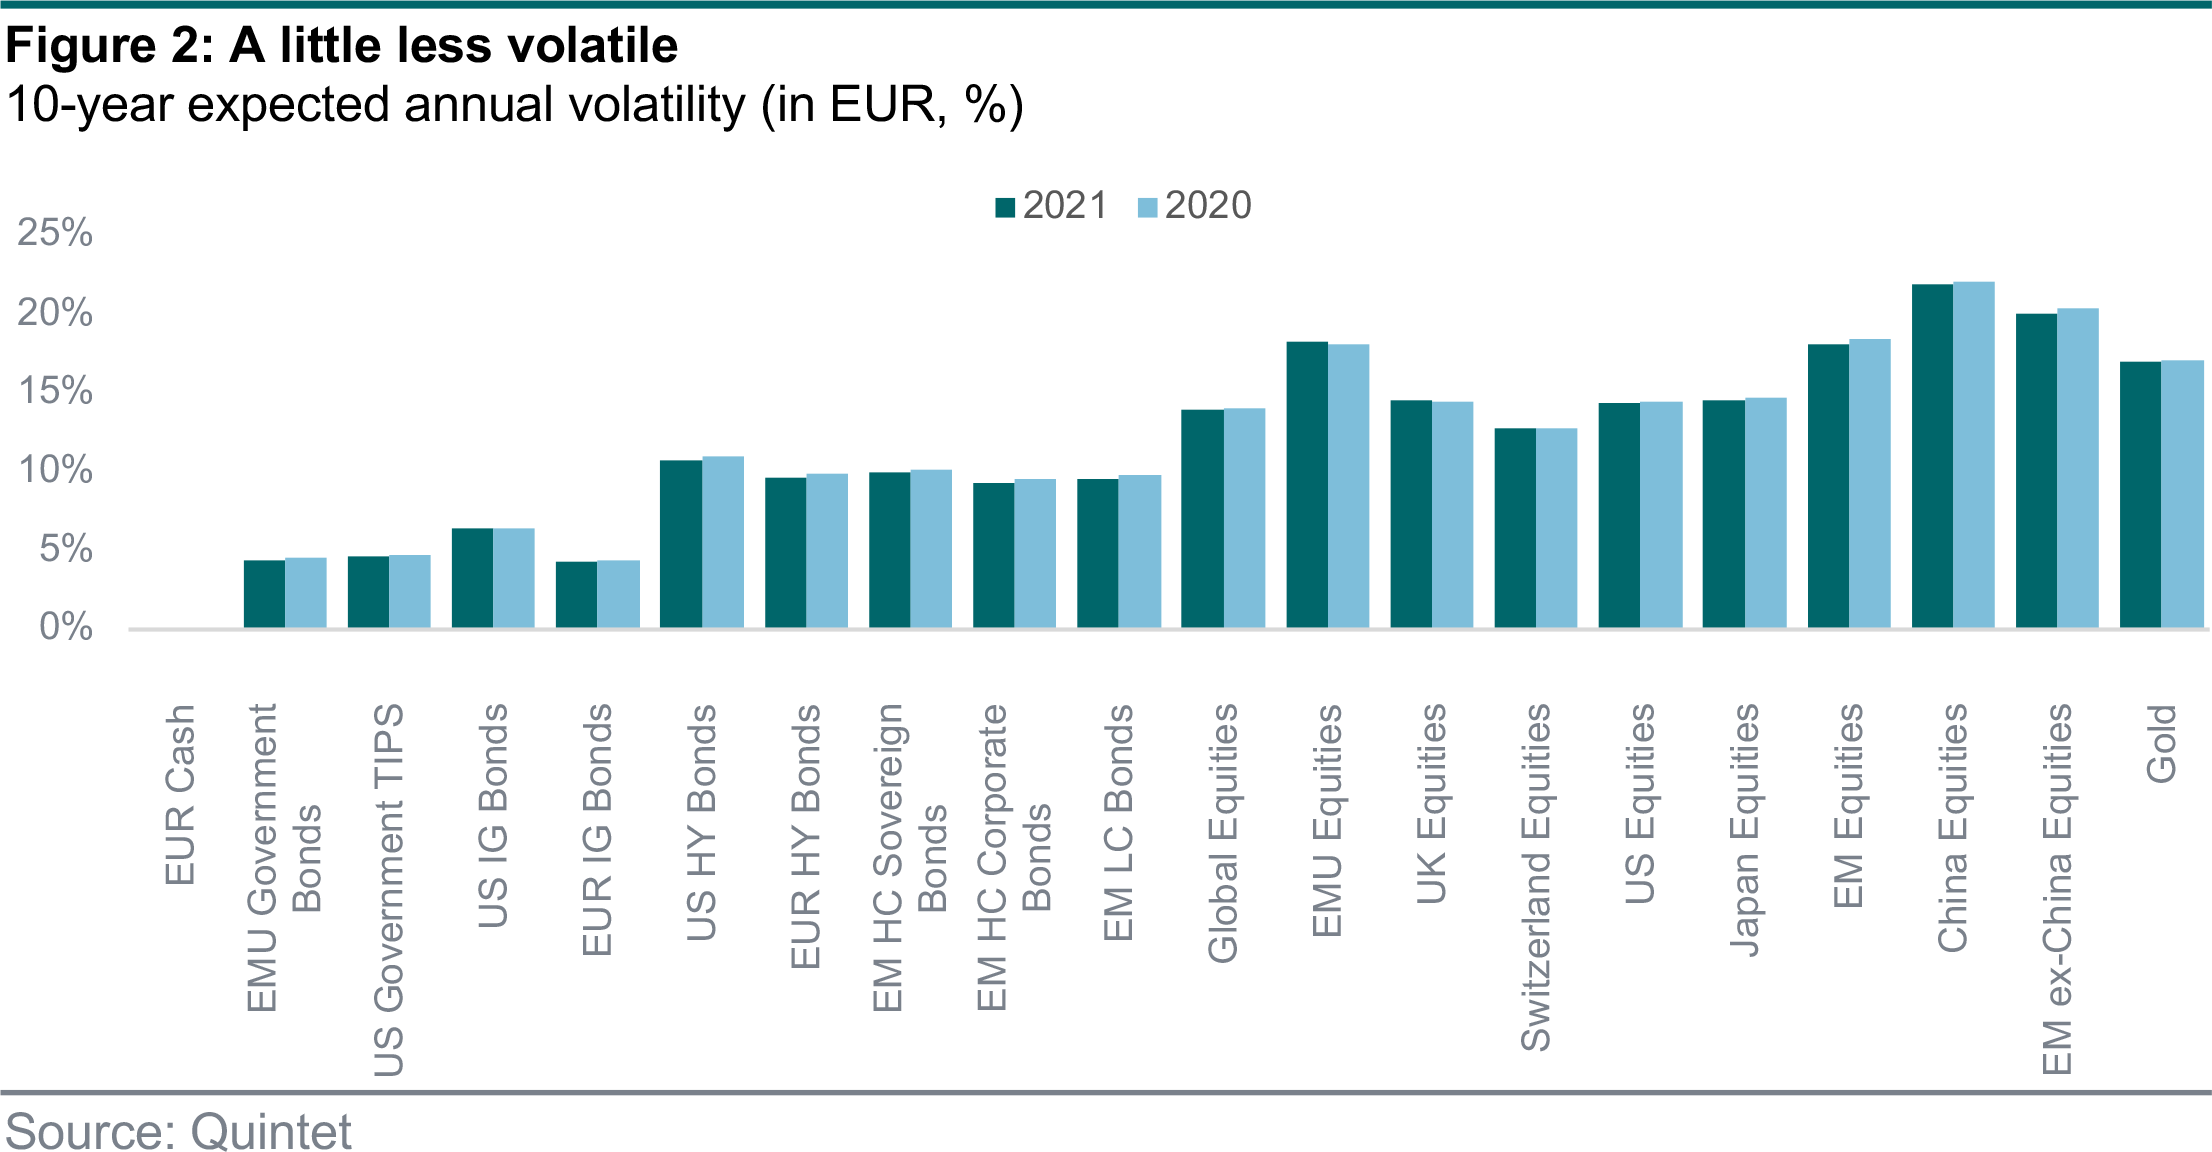
We also forecast that most of the markets we cover in our SAA universe will be less volatile over the next 10 years than we expected a year ago (figure 2). Lower volatility means a smoother journey for investment portfolios. But the changes are only marginal, averaging 13bps across our asset class universe.
The main reason we expect future returns to be lower than we did a year ago is today’s interest rate environment. We calculate our total returns for each asset class from two components. First, the return from the relevant risk-free interest rate, such as cash or government bonds. Second, the excess return investors can earn from holding the asset class on top of the risk-free rate.
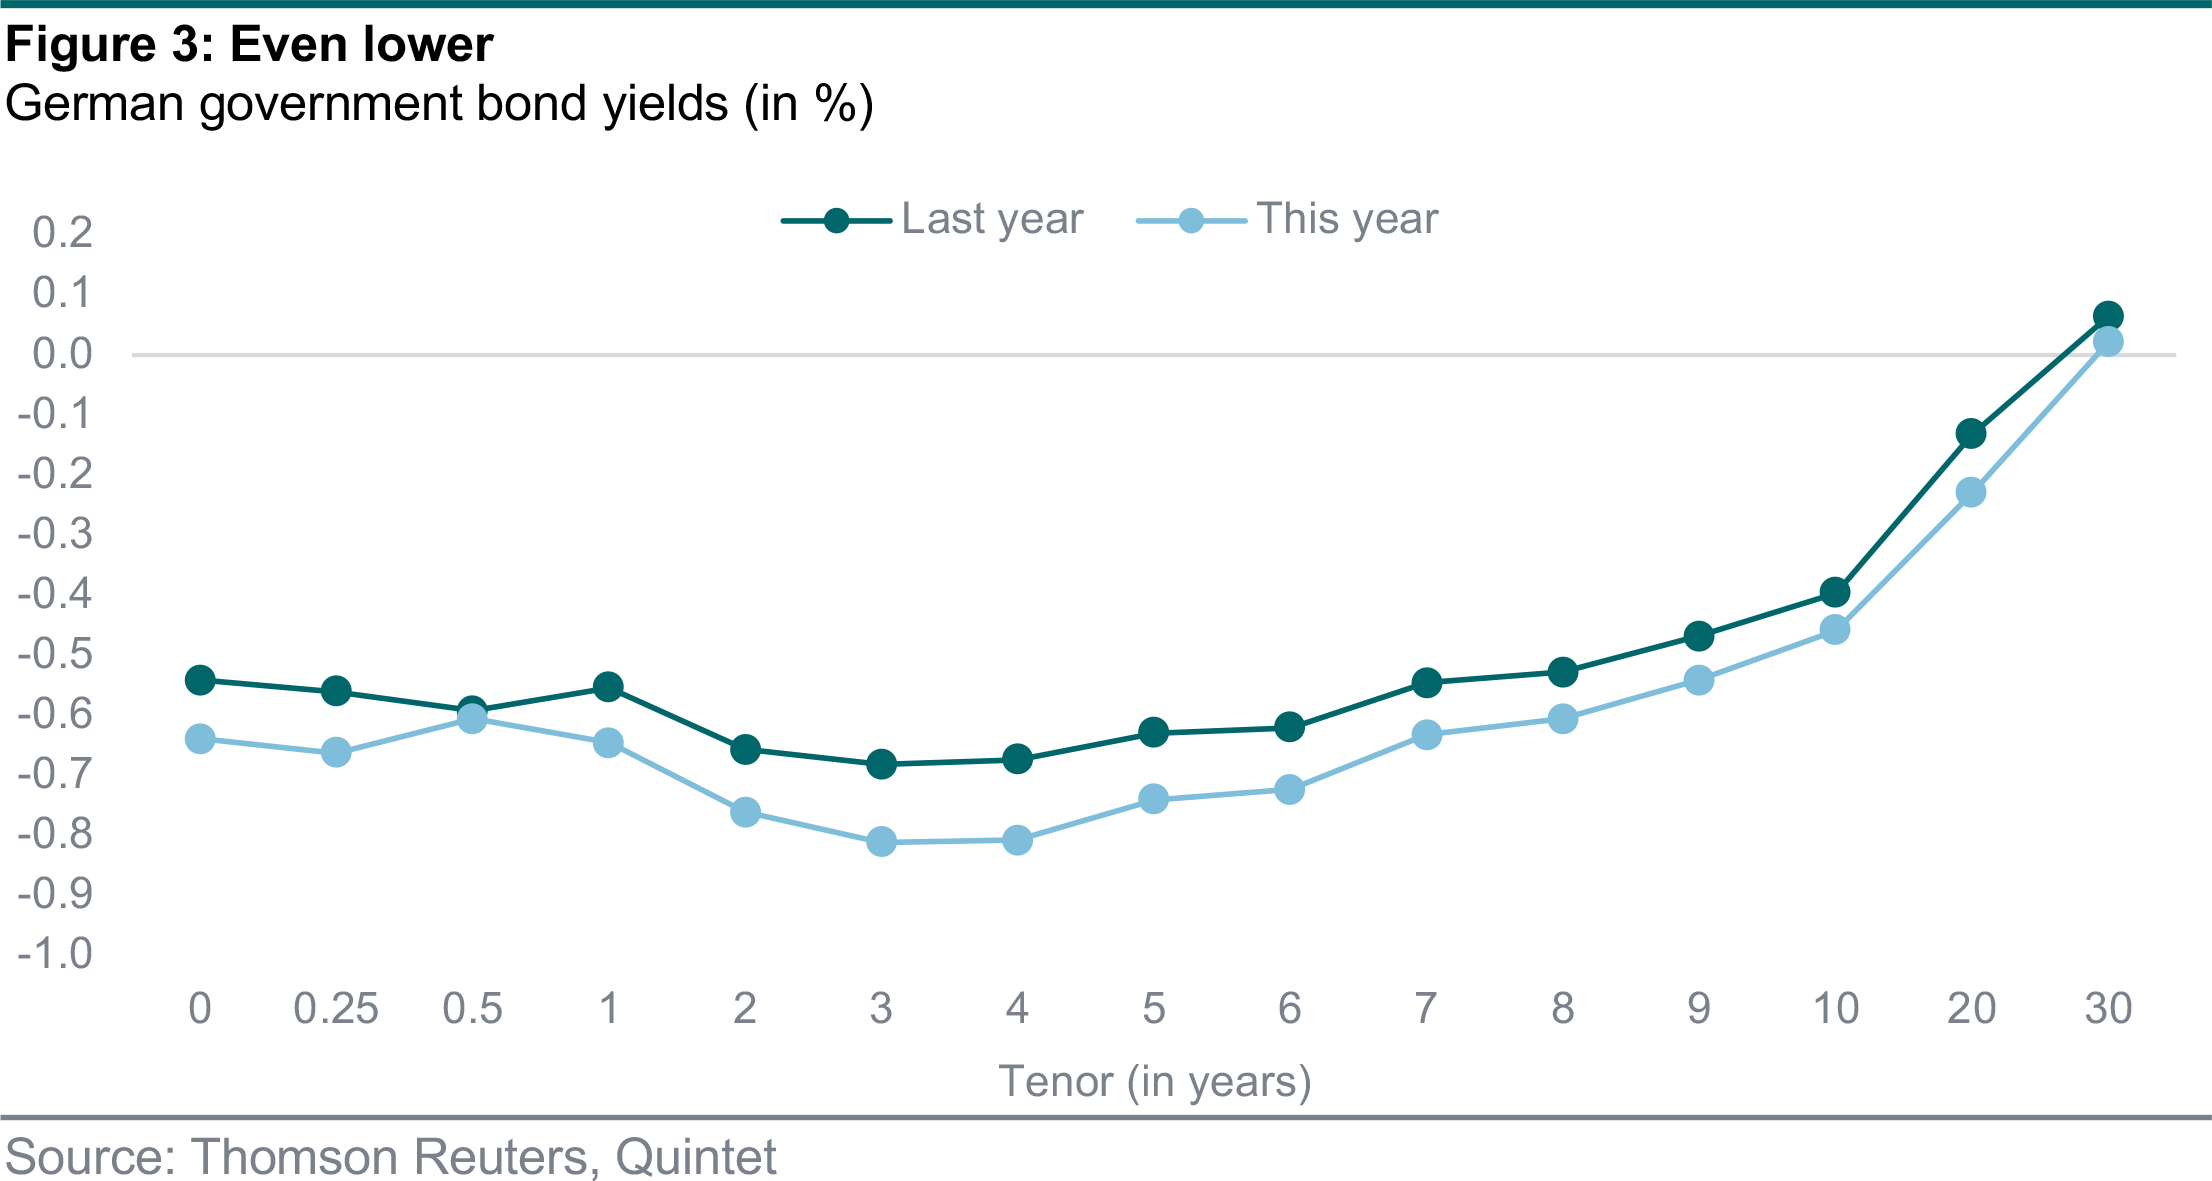
Since launching our CMAs last year, the eurozone government bond yield curve has shifted lower (figure 3). We expect the return on EUR cash and government bonds of most maturities to be negative over the next 10 years. The move lower in the risk-free rate drags down the overall return expectation for each asset class unless we expect an offsetting effect in the risk premium. Our models suggest that across the different asset classes that span our SAA universe, there are changes in the risk premia, but they are either not enough to compensate for lower yields or they are compressing the expected returns further.
After updating our CMAs, the next crucial step is to find the most attractive long-term portfolio allocation. We’ve designed them to provide the best risk-adjusted return for each risk profile. While our CMAs have changed significantly across all asset classes over the past year, the relative attractiveness between asset classes has not. The portfolio weights are unchanged in our SAAs. That means we haven’t changed how much we allocate to each of the asset classes in our universe.
Specifically, with our new CMAs, we do not find any material reasons to deviate from market-cap weights in our regional equity allocation. Within our optimisation procedure, we also set the minimum size of any allocation to 2%. For example, Swiss equities have a slightly higher weight in our SAAs than the market’s size. The largest position in our regional equity allocation remains US equities.
Within our allocation to bonds, we overweight global credit in our SAAs relative to market-cap weights. Government bonds continue to play an important role as diversifiers in our portfolios. But with expected returns negative, our shift away from the asset class towards riskier but higher- yielding bonds remains warranted in search of the best risk-adjusted returns.
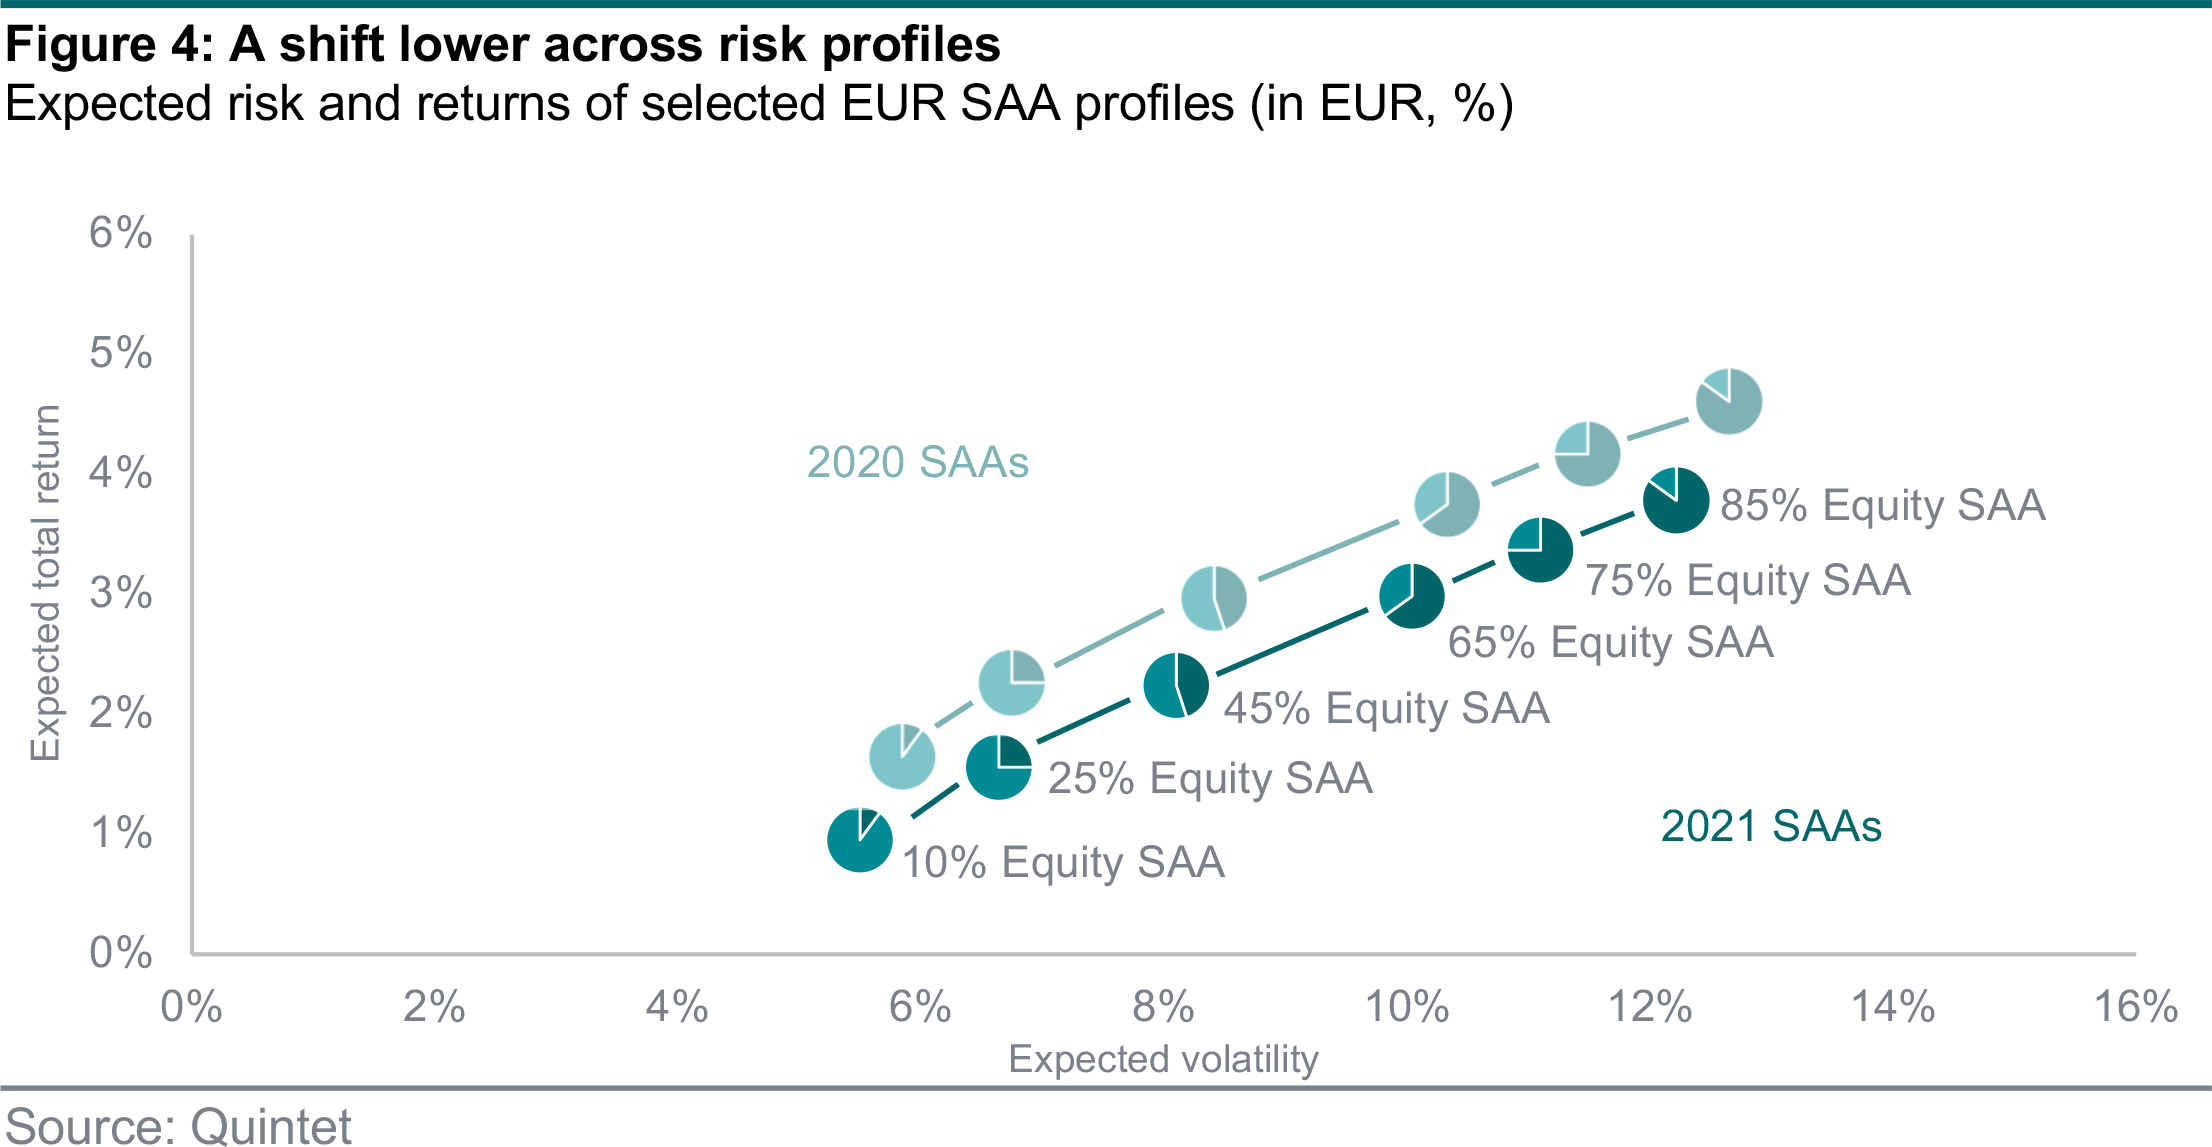
What do these changes mean for portfolios? The return we expect for our EUR SAAs across risk profiles over the next 10 years is lower than we envisaged last year and also lower than over the past few decades (figure 4). We now expect a well-balanced SAA with 45% of its allocation in equities to average 2.3% growth every year over the next 10 years. The expected volatility for such a portfolio is 8.1%. That is also slightly lower than we expected a year ago.
Importantly, the shift lower in expected returns does not come at the cost of a significantly altered Sharpe ratio – which measures a portfolio’s risk-adjusted returns relative to the risk-free rate. The Sharpe ratios across our SAA risk profiles are slightly lower only for the riskier strategies. That means the expected excess returns over cash of our portfolios are mostly unchanged from a year ago. In other words, when deciding between investing in one of our core SAA solutions or cash savings, the merits are still the same as they were a year ago (figure 5).
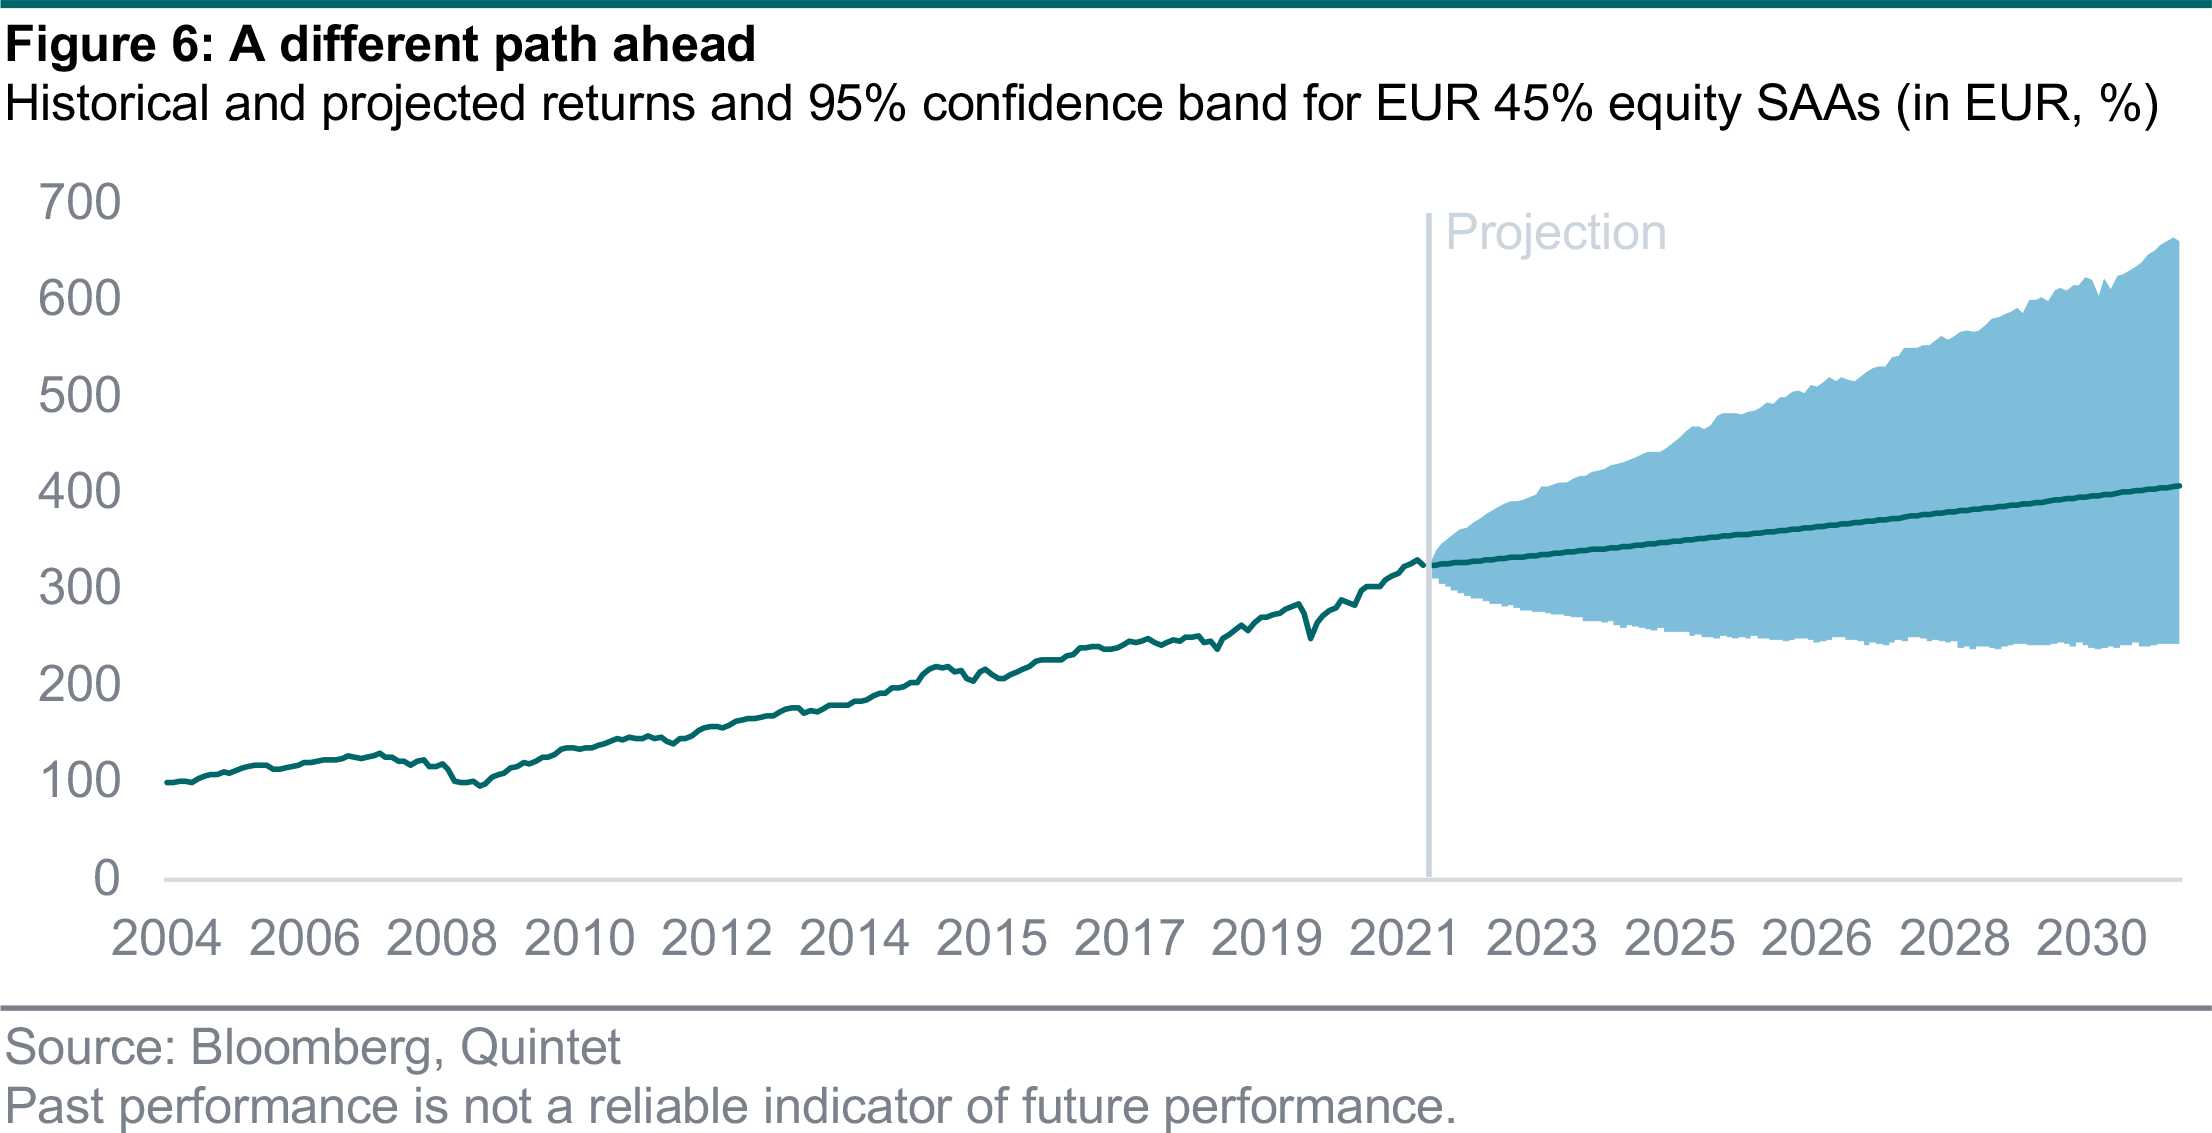
What has changed is that after an extraordinary year for financial markets, the returns we can expect in any given year are lower. That is not a result of how we construct portfolios but of low yields and high valuations (figure 6).
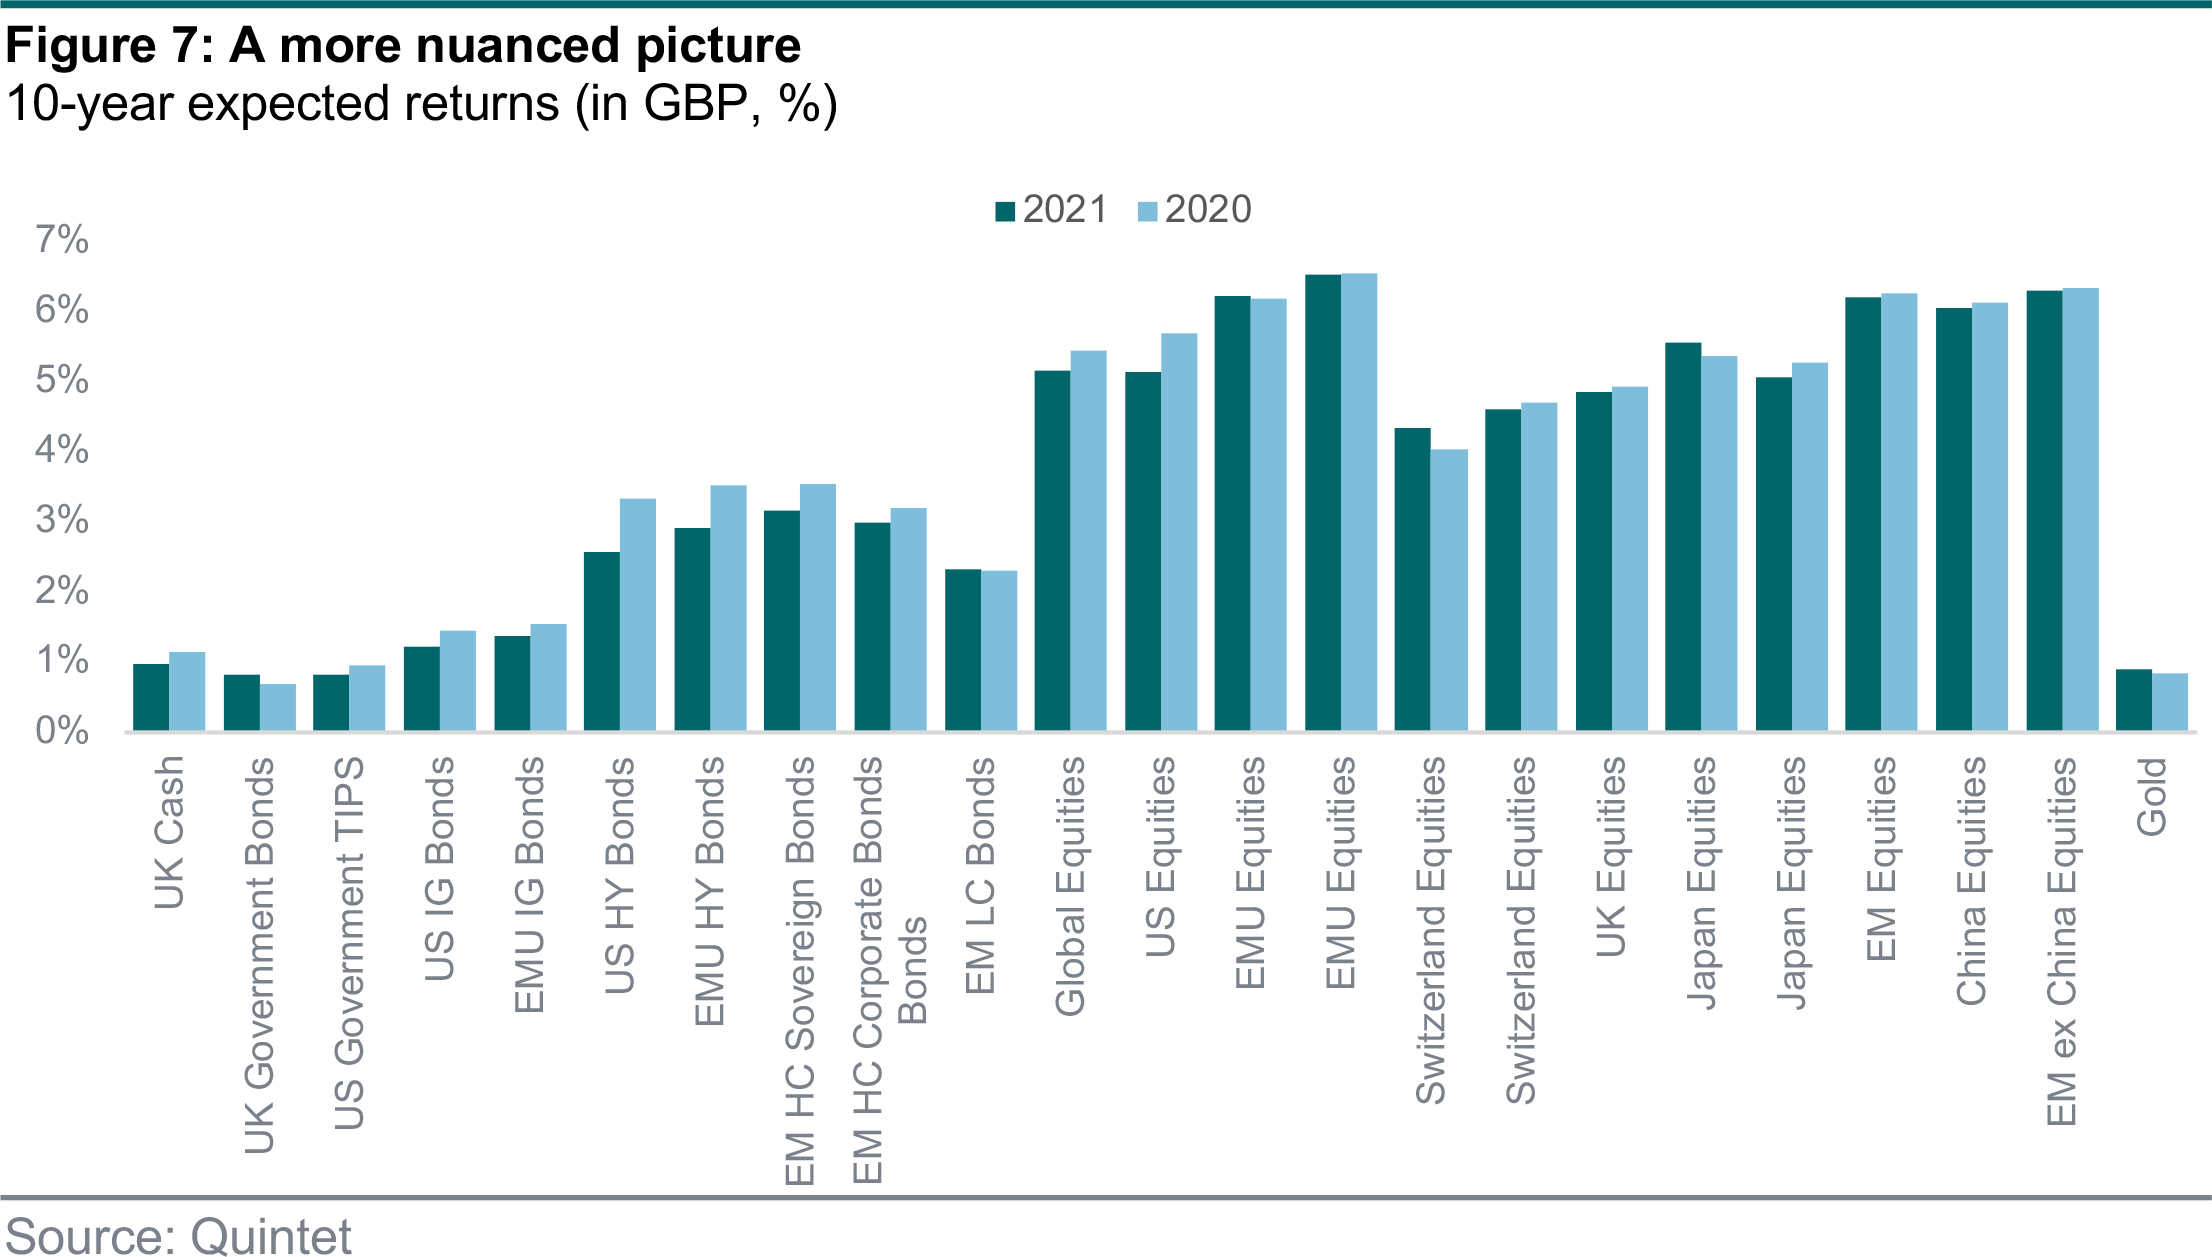
Not all investors are EUR-based and we estimate expected risks and returns for the asset classes in our universe in GBP, USD and CHF as well. For our GBP-based clients, the changes in CMAs are a bit more nuanced. Our return expectations for riskier bonds and US equities are lower than we expected a year ago. The risk premium for these asset classes has compressed. But the changes from last year are more incremental than for EUR-based investors and some asset classes have more return potential than we forecast last year.
For instance, we expect UK equities to return 4.9% on average per year over the next 10 years, and UK government bonds should return 0.8% each year (figure 7). For USD-based investors things are more nuanced, while the changes in our CMAs in CHF mirror more those in our EUR ones.
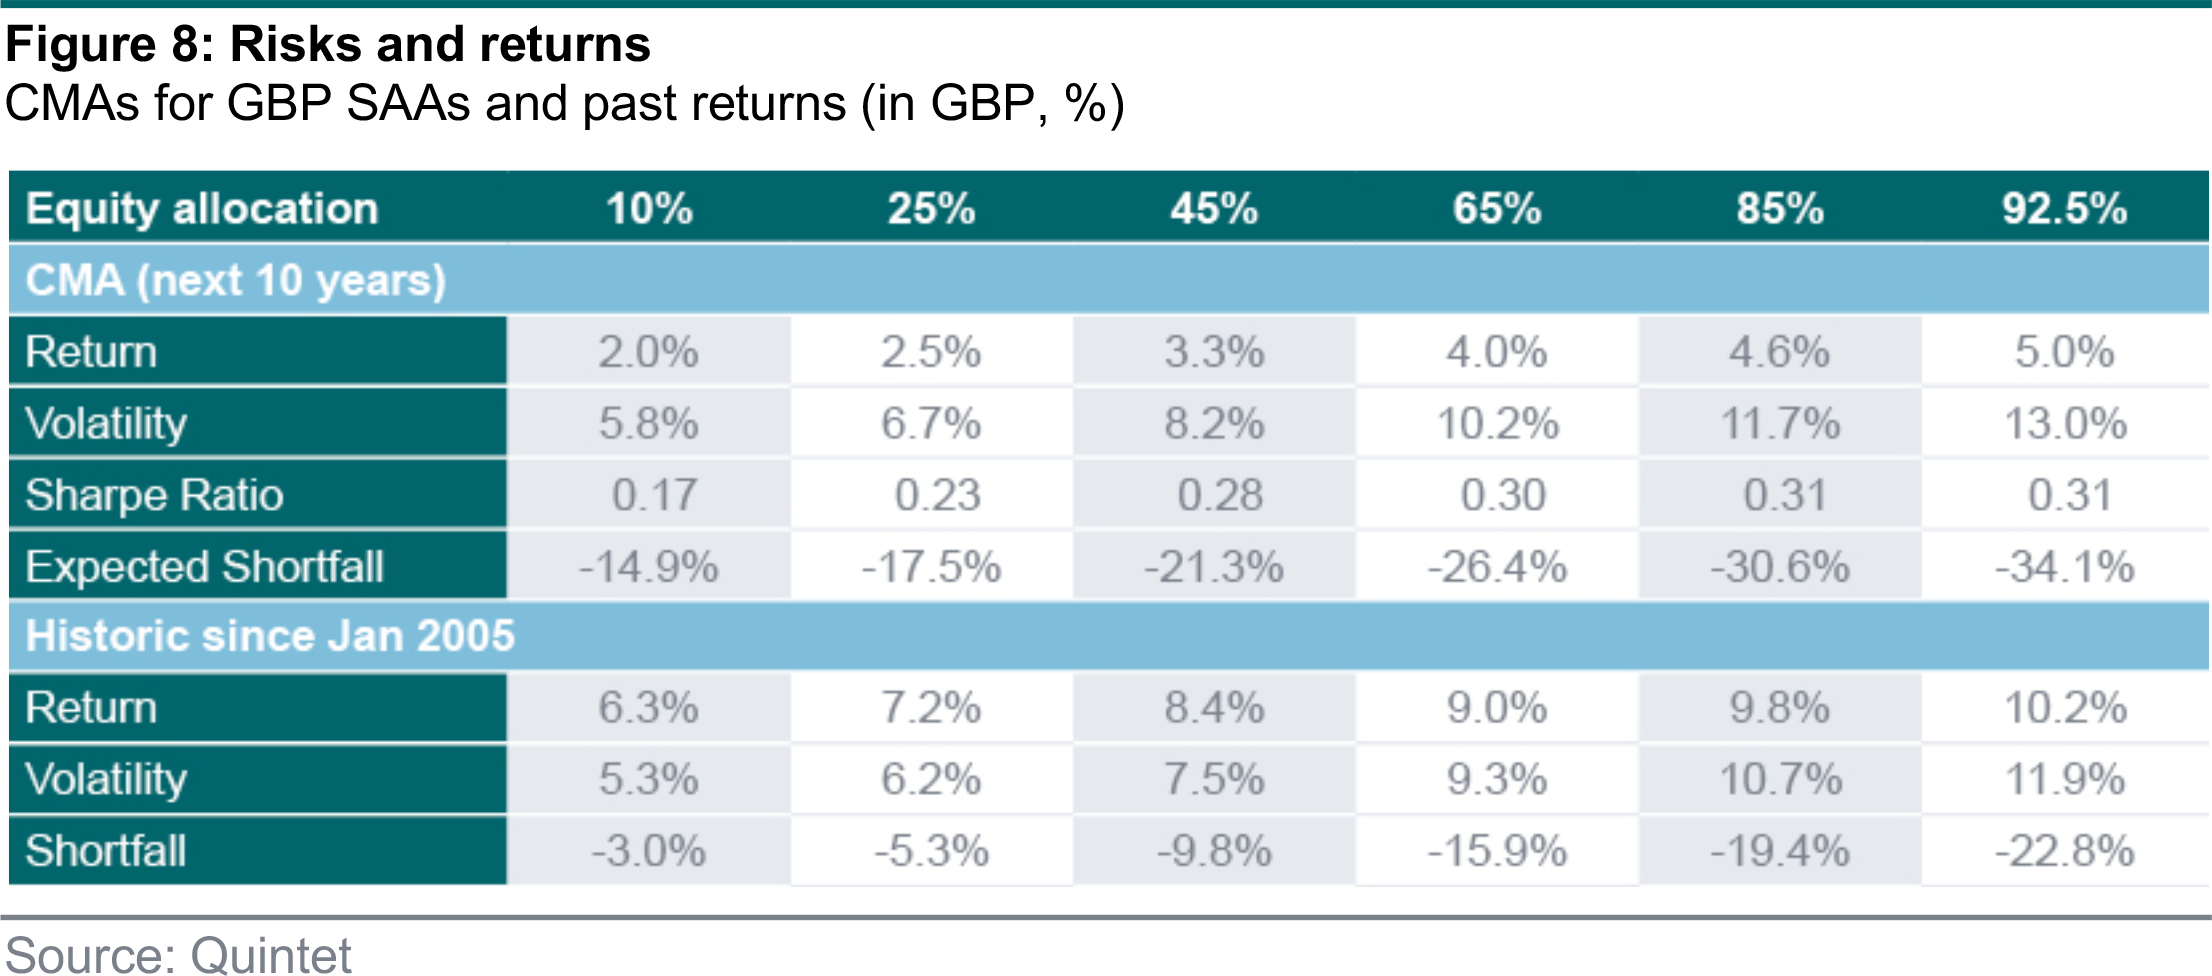
Summing up the new CMAs to the portfolio level, we find that our GBP SAA with a 65% allocation to equities should generate a 4% annual return on average over the next 10 years. That is about 30bps lower than we had expected a year ago. The volatility an investor must accept for such a portfolio is 10.2%, which also 30bps lower than a year ago (figure 8).
In order to manage portfolio risk adequately, the SAA should be the main driver of risk and return over the long term. A key pillar of our well-constructed long-term portfolios are our CMAs.
This year’s CMA update suggests future expected returns will remain low relative to recent decades, and for EUR-denominated assets they are lower than our forecasts from last year. The main reason is a shift lower in the eurozone government bond curve although our models suggest additional compression in the risk premium for some asset classes. The story is slightly different for the CMAs in some of our other base currencies. Changes in expected returns are more nuanced in GBP and USD.
Lower asset class returns mean lower portfolio returns. We now expect a well-balanced EUR SAA with 45% of its allocation in equities to average 2.3% growth per year over the next 10 years. The expected volatility for such a portfolio is 8%, which also slightly lower than we expected a year ago. However, on a risk-adjusted basis, our SAAs remain attractive compared to holding cash. The Sharpe ratios are nearly identical to our estimations from a year ago.
Lower returns are not a result of how we construct portfolios but rather a consequence of the low yield and high valuation environment. The most important decision remains to stay invested and follow a well-defined and well-executed investment strategy.
Authors:
Patrik Ryff Strategic Asset Allocation Strategist
Philipp Schöttler Cross-Asset Strategist
Carolina Moura-Alves Group Head of Asset Allocation
Bill Street Group Chief Investment Officer
This document has been prepared by Quintet Private Bank (Europe) S.A. The statements and views expressed in this document – based upon information from sources believed to be reliable – are those of Quintet Private Bank (Europe) S.A. as of 8 November 2021, and are subject to change. This document is of a general nature and does not constitute legal, accounting, tax or investment advice. All investors should keep in mind that past performance is no indication of future performance, and that the value of investments may go up or down. Changes in exchange rates may also cause the value of underlying investments to go up or down.
Copyright © Quintet Private Bank (Europe) S.A. 2021. All rights reserved.