


US elections: the aftermath
- Political risk, including the US election, was one of the speed bumps we expected in the fourth quarter. Together with the resurgence of the Covid-19 outbreak, it’s one of the reasons why we reduced our US equity exposure from overweight to neutral.
- While the presidential race turned out to be closer than expected, with Donald Trump outperforming expectations, Joe Biden won and was declared president-elect. But we may get a split Congress once again, although this isn’t a done deal yet.
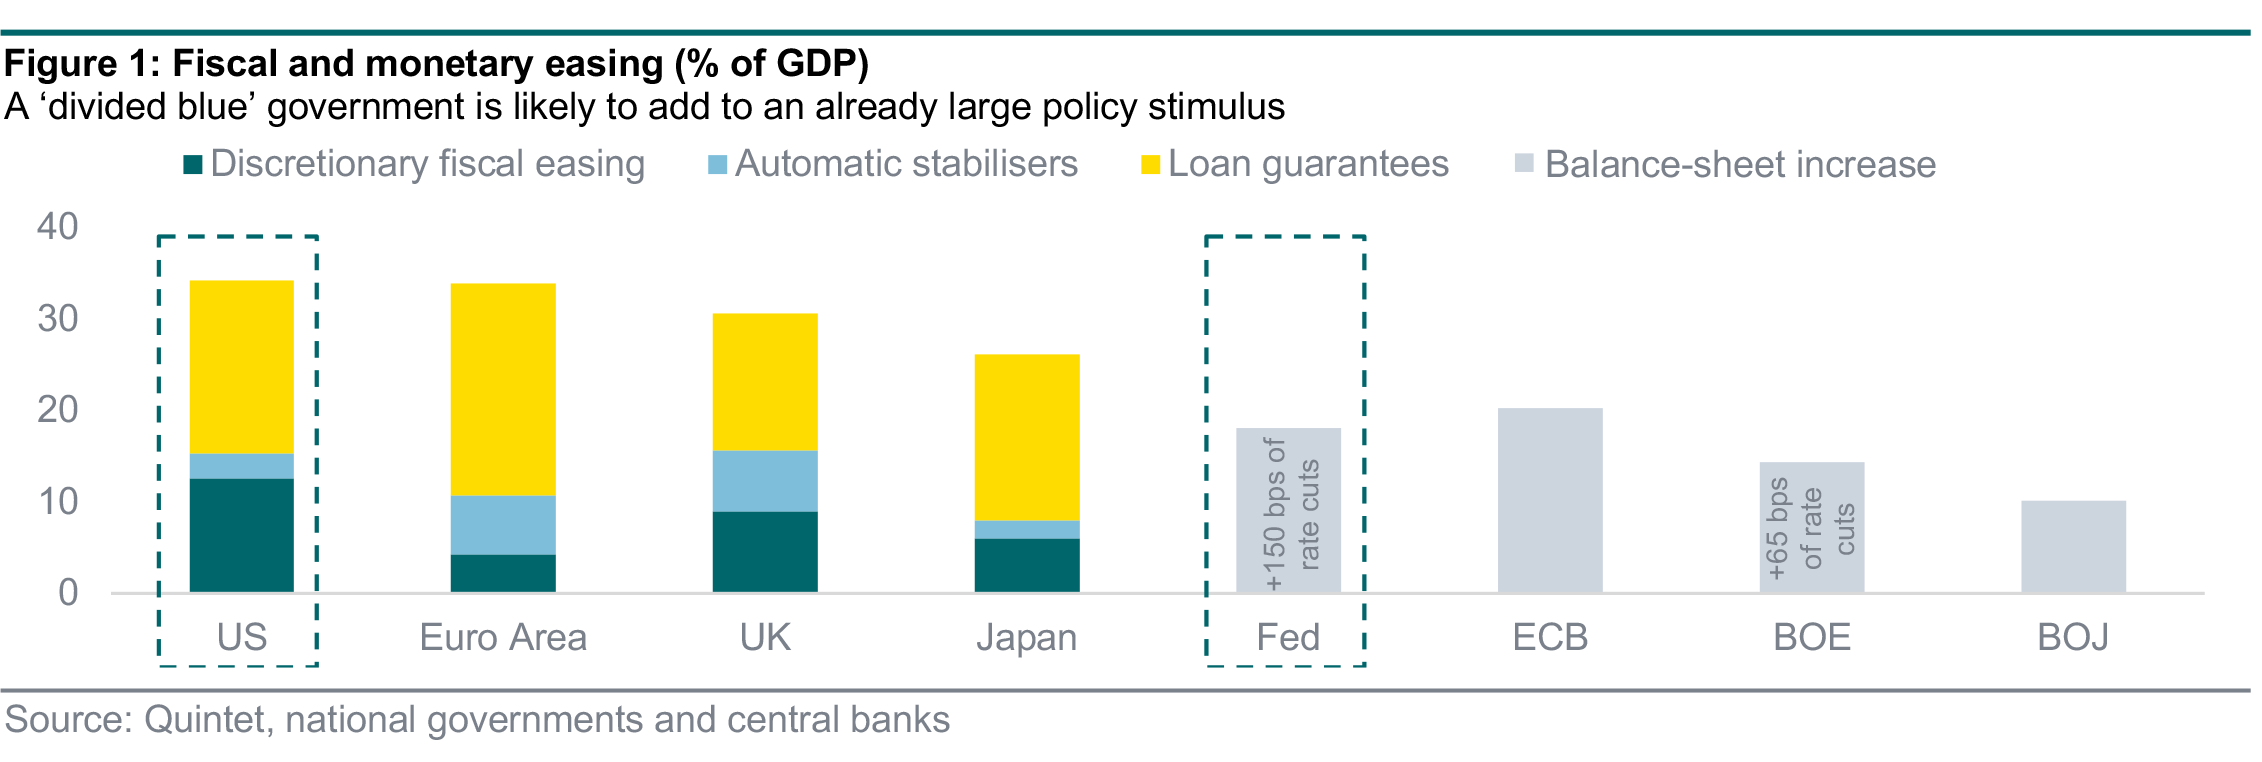
- A ‘divided blue’ scenario is what seems most probable right now, though there’s an outside chance of a ‘unified blue’. If confirmed, this should imply fiscal stimulus – but not as much as with a Democratic sweep – and no major tax and/or regulatory changes.
- Vote recount requests, as well as legal and other challenges, suggest that political volatility will likely remain high for a while longer. While there’s a process for resolution, this could impact sentiment, although financial markets have been quite resilient so far.
- The overall macro backdrop tends to be a bigger driver of post-election market performance than politics. Medical improvements and policy ultra-stimulation suggest that, once the virus is contained, an early-cycle phase of recovery and reflation should take place.
Our framework to think about US political scenarios is based on the observation that the key election outcome, from an economic and market point of view, isn’t just the winner of the presidential race. Rather, it’s whether the US continues to be led by a divided government or if voters deliver a unified government – with the same party controlling the House of Representatives, the Senate and the White House. As history shows, divided US governments tend to face gridlock, while unified governments hold the promise of significant policy change (figure 1).
While votes are still being counted, the major media outlets have indicated Biden as president. The focus is now shifting to whether and when Trump eventually concedes – a complex situation from a market point of view, which could raise uncertainty further. While the House of Representatives looks set to remain under Democratic control, Republicans and Democrats are in a neck-and-neck race to gain a razor-thin majority in the Senate – with two run-offs in Georgia in January. This may determine whether we’ll ultimately get a ‘divided blue’ or a ‘unified blue’ government.
At the time of writing, it looks as if we’ll continue to have a split Congress, implying a ‘divided blue’ government: the House of Representatives is staying Democratic, while the Republicans look set to retain their Senate majority (but this isn’t certain yet). Even though a ‘unified blue’ is still possible – and there’s been no shortage of surprises in this election – its probability seems lower to us: our best guess is that a split Congress is more likely than not. If confirmed, this would likely result in at least some degree of political gridlock and, therefore, no major policy changes seem probable.
Biden’s plan does look market-friendly, though one near-term risk to the economy is that he may look at European-style, partial lockdowns more favourably than Trump did. In a ‘divided blue’ scenario, we would expect some extra fiscal support to be announced by early next year – a significant but more modest package relative to a ‘unified blue’ scenario. This could be around $1 trillion (about 5% of GDP), with a focus on virus-related income support initially, but also some infrastructure spending further down the road.
While it’s possible that we may see moderate re-regulation efforts affecting sectors such as pharmaceuticals, technology, energy and financials – along with tighter environmental standards – we think that a lack of congressional control should mitigate the extent of any legislative effort on this front. Higher corporate taxes could still come through, but more as a tail scenario and not necessarily as early or as much as initially envisaged. The substance of China relations is likely to stay unchanged, but the communication style could improve. EU relations and the US engagement with the rest of the world, including in multilateral organisations, should get better too.
Things would be different in a ‘unified blue’ scenario, where corporate tax hikes would be the base case – a direct hit to earnings – and sector regulation and oversight would increase more meaningfully. However, simply winning the Senate would not be enough for Biden to implement sweeping regulatory changes. This is because 60 votes out of 100 are needed to overcome filibustering. Conversely, only a ‘reconciliation bill’, which just requires a simple majority, would be needed if he wanted to restore the top marginal income-tax rate to 39.6% for those earning over $400,000 a year and to partially reverse Trump’s corporate tax cuts, raising the rate from 21% to 28%.
Equities have responded well to the possibility of a ‘divided blue’ government. US Treasury yields have trended down on the back of valuation changes across different fiscal paths. We don’t regard this as a risk-off move. Rather, it may simply reflect the collapsed probability of a ‘blue wave’ – the most fiscally expansionary scenario, which could have driven bond yields higher. Of course, it’s possible that a particularly uncertain situation, such as a more heavily contested result, could still negatively impact market sentiment. But, when this gets resolved (and there’s a path to deliver a new president from January 21), we think the market will refocus on the macro fundamentals.
A close look at US election cycles over the past 20 years reveals that, while significant legislative change is likely to be key over the medium term, the economic backdrop has been a far bigger driver of short-term market performance than the presidential winner or winning party.
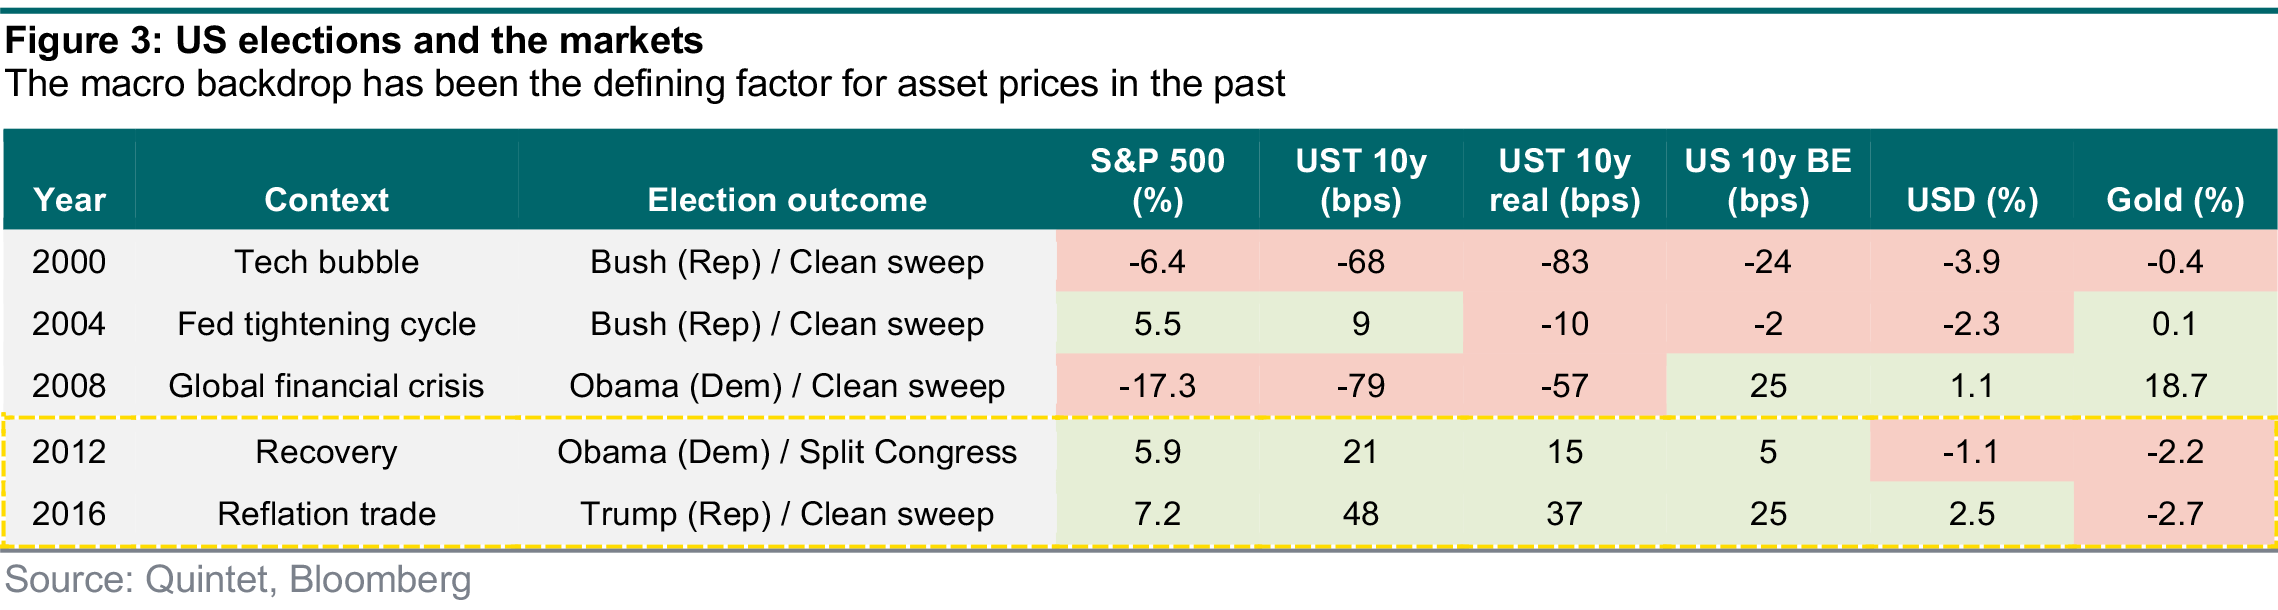
The pullback in the S&P 500 and Treasury yields following the 2000 and 2008 elections, when different parties won in clean sweeps, was more likely because of the crises prevailing at the time – and not necessarily a reaction to the election outcome. The gains in stocks and bond yields in 2004 and 2012, when different parties won the White House, had to do with an improving economy and the easing of the euro crisis. The market rally following the 2016 Trump election and Republican sweep owed much to a sense of reflation and ongoing optimism about growth.
As the lessons of history suggest, US market performance in the months following this year’s election is likely to depend on how the pandemic is eventually overcome and on the US and global macro situation (figure 3). This isn’t to say that politics isn’t a market driver at time. Rather, it’s an observation that it’s not the driver. Basically, we believe that the combination of over-stimulation on both the monetary and fiscal sides and significant medical improvements could eventually take us to a recovery/reflation phase similar to those following the 2012 and 2016 elections – although one was won by a Democrat with a divided Congress and the other by a Republican with a clean sweep.
- The third-quarter earnings season has been much better than expected, with many companies reporting relatively strong earnings and sales growth.
- The US continues to outperform Europe for a variety of reasons, including its technology giants, which have been the standout winners.
- The results from a handful of individual companies can significantly influence the performance of a whole industry sector, and it’s helpful to understand how and why.
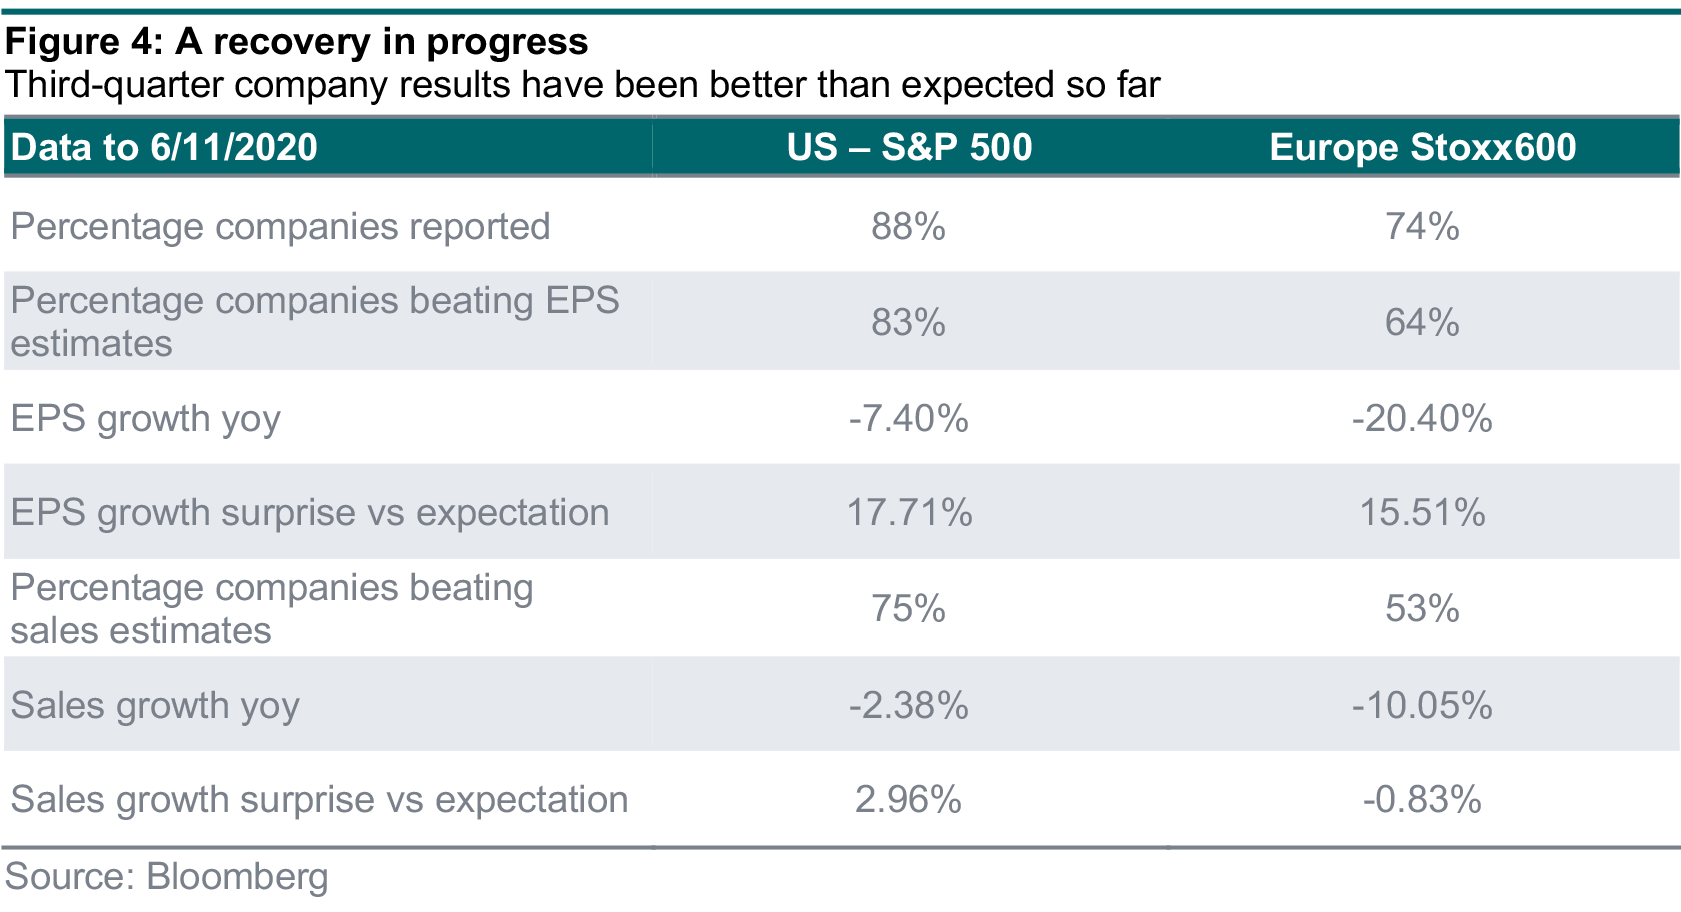
With almost 90% of companies in the US and 75% in Europe having announced results, the thirdquarter (Q3) reporting season is not over yet but most bellwethers (the market leaders in their respective sectors) have reported (figure 4). Although we look at the numbers, we also remain focused as always on medium- to longer-term trends rather than on assessing companies and sectors based on single quarters.
After a second quarter that showed substantial drops in year-over-year profits (down 30% in the US and 65% in Europe), a sharp rebound in economic activity has led to Q3 revenues and profits rebounding sharply. Overall, earnings per share growth continues to be negative on a year-overyear basis, remaining 7% below Q3 2019 levels in the US, and 20% below Q3 2019 levels in Europe. Sales remain 2% below last year’s levels in the US and 10% lower in Europe.
Both the US and Europe are surprising versus expectations, with earnings growth in aggregate around 17.5% better than analysts expected in the US and 15.5% in Europe, a sign that analysts have lowered their expectations substantially – and maybe even excessively. That’s why share prices have tended to not react too much to these surprises, which reminds us that consensus expectations are a lagging indicator, and that these better earnings were already largely priced in.
Outside the US and Europe, Japan, where only about half of the companies have announced results, is so far reporting a larger aggregate surprise on the earnings front (25% better than expected), but with only 60% of firms beating earnings expectations.
US beats Europe (again)
We note a difference between Europe and the US in that 83% of companies have beaten estimates in the US versus only 64% in Europe. According to FactSet, the US is on track for setting the highest beat percentage since records began in 2008.
The regional differences are essentially down to sector composition. The US has benefited from the solid growth coming from its substantial exposure to the internet-related sectors, such as consumer discretionary (the Amazon effect), as well as technology and telecoms, which have had solid midsingle-digit positive sales growth in the last 12 months. In Europe, where the exposure to tech is much smaller, there has simply been a lack of positives to offset the negative growth from cyclical and more ‘physical’ segments, such as industrials, materials and consumer discretionary.
Beneath the sector trends
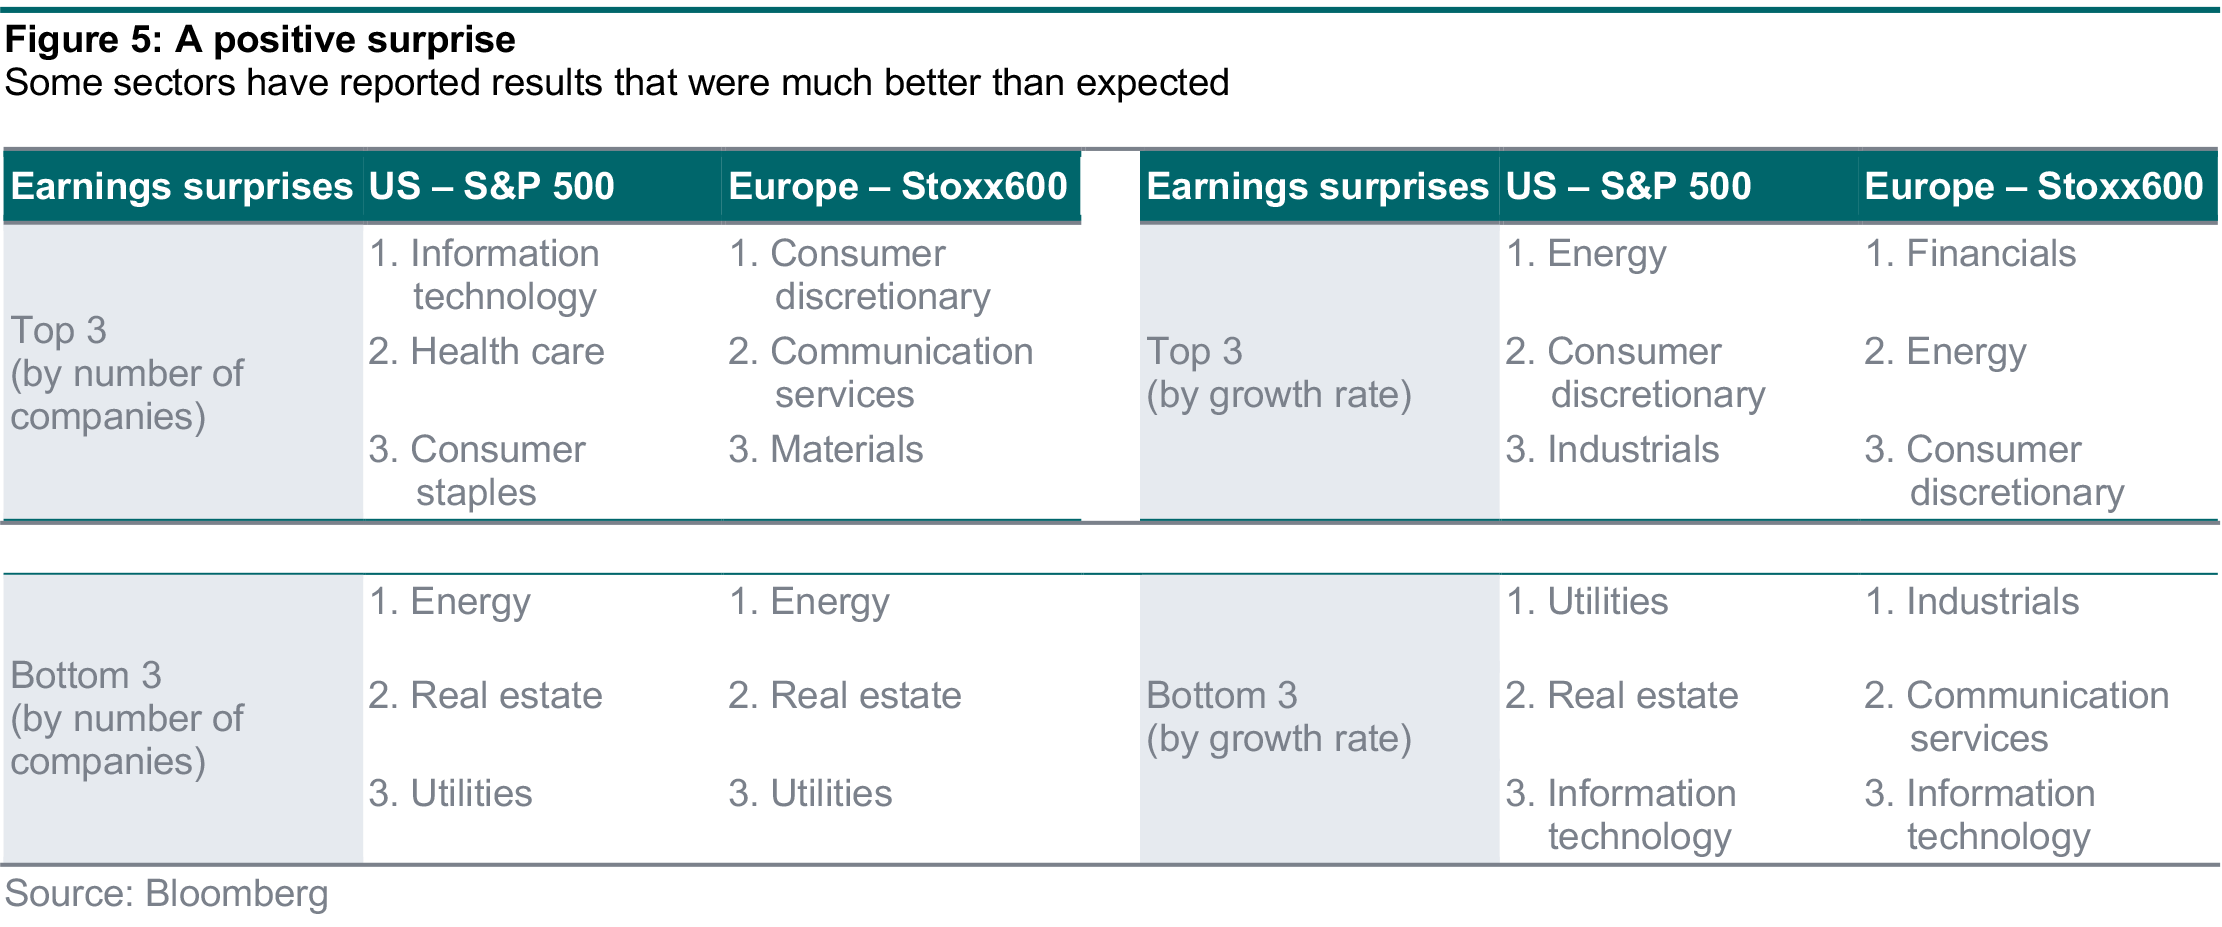
The performance of each sector is often driven by results from a small number of companies within them (figure 5). Following we explore what’s happened in the third quarter by industry.
Technology. The US tech sector has enjoyed the highest proportion of companies beating expectations in the market at 95%. However, the extent of the growth surprise was one of the lowest in the market. Indeed, index heavyweights such as Apple only reported earnings that were 5% better than expected, with Intel and Accenture disappointing, while the aggregate market earnings surprise amounts to 17%. Within technology, there was also notable discrepancy in that Microsoft reported figures that were 17% better than expected, driven predominantly by stronger cloud service results.
Consumer discretionary. In the US, the sector posted a strong earnings growth surprise, which was largely led by index heavyweight Amazon. It accounts for 35% of the sector by sales and has been a significant winner of the pandemic due to the increased market share from online retail and the expansion of its cloud business AWS. Traditional auto companies Ford and General Motors also reported strong figures, and as both companies account in aggregate for 25% of the sector’s sales, their impact was noteworthy and their shares have performed strongly in recent weeks. In Europe, the shape of the consumer discretionary sector is clearly different due to the lack of internet exposure, but it also ranks highly with a higher percentage of beats and a high aggregate earnings growth surprise. Automakers Fiat Chrysler and BMW have been among the top contributors although their share price reactions were much more muted than their US counterparts. It’s important to note that a number of consumer discretionary companies in Europe have not reported yet.
Energy. The sector ranks well on aggregate growth surprises but this is really down to the large surprises from index heavyweights Shell and Total in Europe, and Phillips66/Valero/Marathon in the US. However, the percentage of energy companies beating expectations was one of the lowest in the market in comparison (53%) and share price performance did not improve materially on these better results. This sector continues to be challenged in the short term because of the reinstatement of lockdown measures to contain the spread of Covid-19. In the long run, the move to renewables and electric vehicles should remain a structural headwind for the energy sector where fossil fuel revenues remain the main driver. The sector’s fortune should not be a major concern for investors because it now accounts for just 2.8% of the MSCI World index versus almost 15% back at the peak in 2008 when it was the second-largest sector globally after financials.
Financials. European bank earnings were the biggest positive surprise in terms of both aggregate earnings and beating expectations. In particular, most banks this quarter benefited from smaller credit losses than expected. The IFRS9 accounting rules surrounding the provisioning for expected credit losses (ECLs) are relatively new to companies and market participants, which could explain why the share price reactions to better bank earnings have been fairly muted. There could be light at the end of the tunnel for banks on the provisioning side. For instance, the top end of HSBC’s guidance on ECLs for 2021 was lower than consensus estimates.
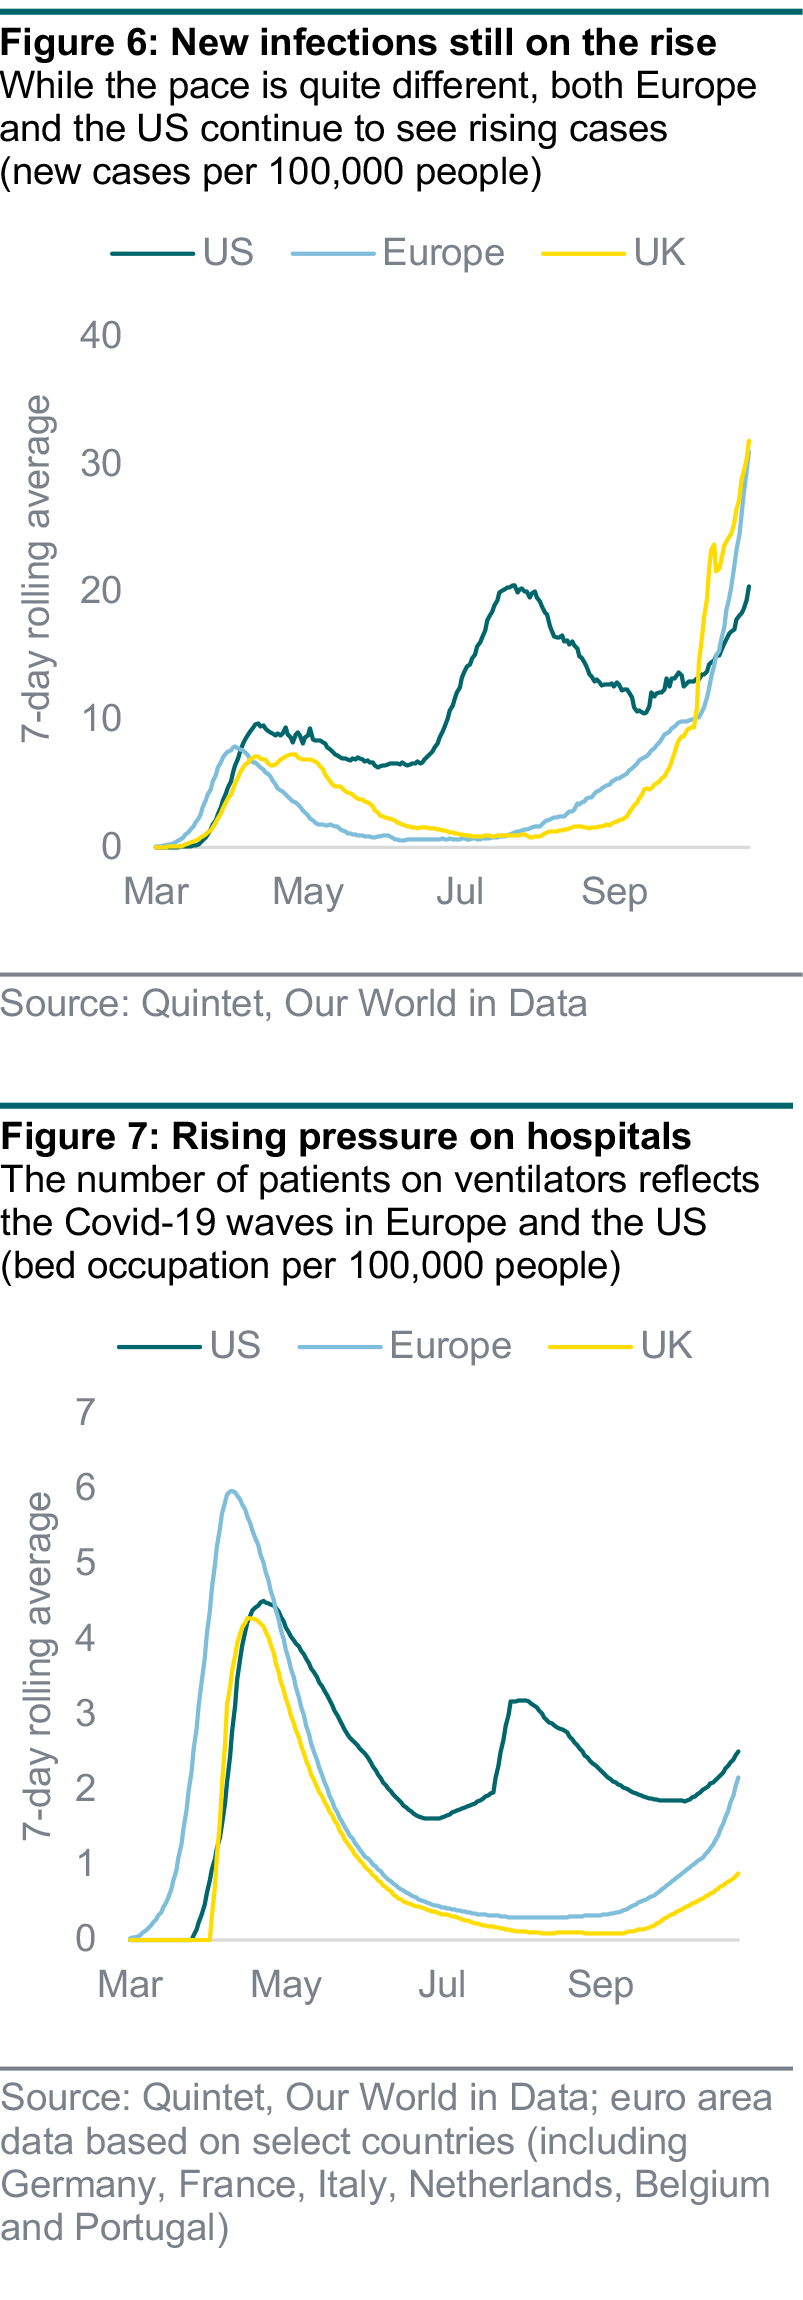
Globally confirmed virus cases continue to rise, and are now exceeding 50 million, with over 1.2 million fatalities. In Europe and the US, the disease is spreading – but European weekly growth rates are now slowing in some countries. After having risen sharply, the number of reported new infections started to fall in Spain and the Netherlands last week, but increased in France, Italy and Germany. New cases in the UK peaked just before the start of the second lockdown in England, which began on November 5.
Looking at seven-day moving averages, while the euro area faces around 40 and the UK around 35 new infections per 100,000 inhabitants, this number stands at around 25 for the US. Nevertheless, the US infection curve continues to inflect higher, due to a broad-based surge in daily new infections, making it the first country to surpass 100,000 new cases in a single day last week. The second wave is escalating in Europe and the third wave is building up in the US (figures 6 and 7). More testing continues to explain some of the numbers – new infection rates in the US are rising twice as fast as in Germany, but less quickly than in other European countries. The number of virus patients undergoing intensive care treatment is approaching the first wave’s peak and rising quickly in Germany and the UK (although not quite as rapidly).
This trend is in line with the increased use of ventilators due to the growing number of people with the virus requiring breathing assistance. At the moment, this problem is most acute in the euro area. For example, more than 70% of France’s intensive care units (ICUs) are now occupied. The US appears to be heading for a situation where its ICUs will soon be full, and the government would then have to reintroduce restrictions to slow the spread of the virus.
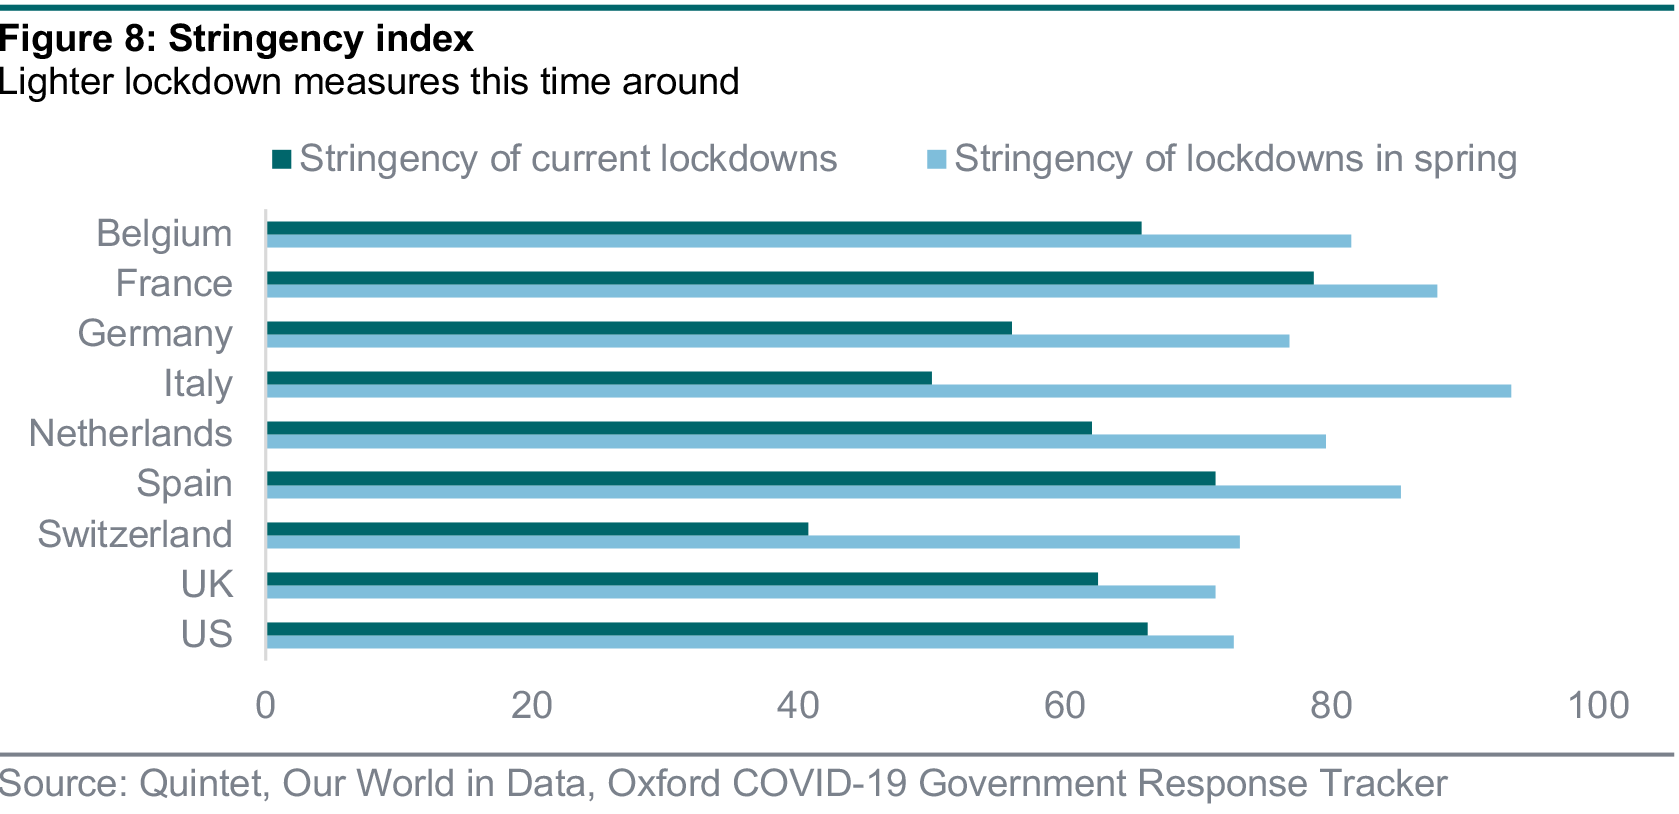
As we know, the widespread lockdowns in the second quarter caused the sharpest ever recession. However, third-quarter GDP figures show that the world economy has bounced back – with quarterly gains of 12.7% for the euro area and 7.4% for the US. When it comes to economic activity in the fourth quarter, the key is that governments have recently reimposed lighter versions of their lockdowns in early spring. The stringency indices show how the restrictions are less severe during the most recent lockdowns in several European countries and the US. This time around, schools and important industrial activities remain open (figure 8).
Depending on the pace and scope of policy stimulus, and on how and when the restrictions are eventually lifted, euro area and UK GDP is likely to contract in the fourth quarter. So far, early indicators in other regions still signal strong growth – mostly in China but also in the US and, generally, across the manufacturing sector. An important factor here is that factories continue to function and momentum in production appears relatively solid, as shown by latest PMI (purchasing managers’ indices) trends, mostly for export-oriented countries such as China and Germany. In contrast, the recovery in services has been weaker and November’s targeted lockdown measures may well impact these activities further.
For Europe, we expect the pace of the increase in new infections to slow going into December. Most countries have reintroduced containment measures and early indications suggest they are working. Retail activity might pick up moderately over the holiday season. Europe looks a bit ahead with its second virus wave relative to the third wave in the US. Although the US economic recovery appears relatively strong, any measures to restrict mobility and activity could be damaging.
Nevertheless, going into 2021, further fiscal and monetary stimulus should boost the economic cycle once again. A further supporting factor would be the first FDA approvals for vaccines, late in 2020 (which would be consistent with today’s Pfizer/BioNTech news) or early in 2021, paving the way for a wider reopening of large parts of the global economy. Researchers are testing many vaccines: 156 candidates are in pre-clinical phase, 33 in phase one, 14 in phase two and 12 in phase three, while six have received limited approval (mainly in China and Russia).
Authors:
Bill Street - Group Chief Investment Officer
Daniele Antonucci - Chief Economist & Macro Strategist
Cyrique Bourbon - Senior Asset Allocation Strategist
This document has been prepared by Quintet Private Bank (Europe) S.A. The statements and views expressed in this document – based upon information from sources believed to be reliable – are those of Quintet Private Bank (Europe) S.A. as of November 9, 2020, and are subject to change. This document is of a general nature and does not constitute legal, accounting, tax or investment advice. All investors should keep in mind that past performance is no indication of future performance, and that the value of investments may go up or down. Changes in exchange rates may also cause the value of underlying investments to go up or down.
Copyright © Quintet Private Bank (Europe) S.A. 2020. All rights reserved