


The yield curve and recession: truth and myth
- We estimate that the Treasury curve, which is inverted at some maturities, implies a US recession probability over the next 12 months of 14%. While recession isn’t our base case, this is broadly in line with (in fact, somewhat lower than) the likelihood of our bear case. The odds do rise at longer horizons, but central banks’ balance sheets may have distorted the signal.
- When an economic contraction inevitably arrives, it would probably be relatively mild, in our view, as the US lacks the financial imbalances that are usually associated with deep recessions. Our analysis also shows that an inversion of the US yield curve isn’t a reliable timer of equity market returns. And the average return from equities remains appealing (18%) after the inversion date until the market peak. When the market does turn, there’s a bias towards defensive sectors and drawdowns are smaller for higher quality stocks.
- Similarly to US equities, US high-yield bonds usually still perform well 12 months after the first curve inversion. Tactically, we’re overweight US equities, Asia high-yield and emerging market sovereign bonds over government and investment-grade bonds. Rising US Treasury yields support our duration underweights. We’re also overweight emerging market over global stocks.
There’s currently an ongoing debate about whether investors should be worried about a forthcoming recession following the recent inversion of some sections of the US Treasury yield curve. To examine what’s actually happening, in this paper we look at the signal embedded in the US Treasury yield curve at different time horizons to back out the recession probability and timing that the bond market is pricing in. Basically, we model the probability that the US economy transitions into recession over the next 3, 6, 12, 18 months and so on as implied by different parts of the yield curve. Yield curves do a reasonable job at anticipating recessions, but there’s variation across time horizons and curve segments. As the curve is steep at the front end but flat or inverted further out, different segments are currently implying different probabilities of recession.
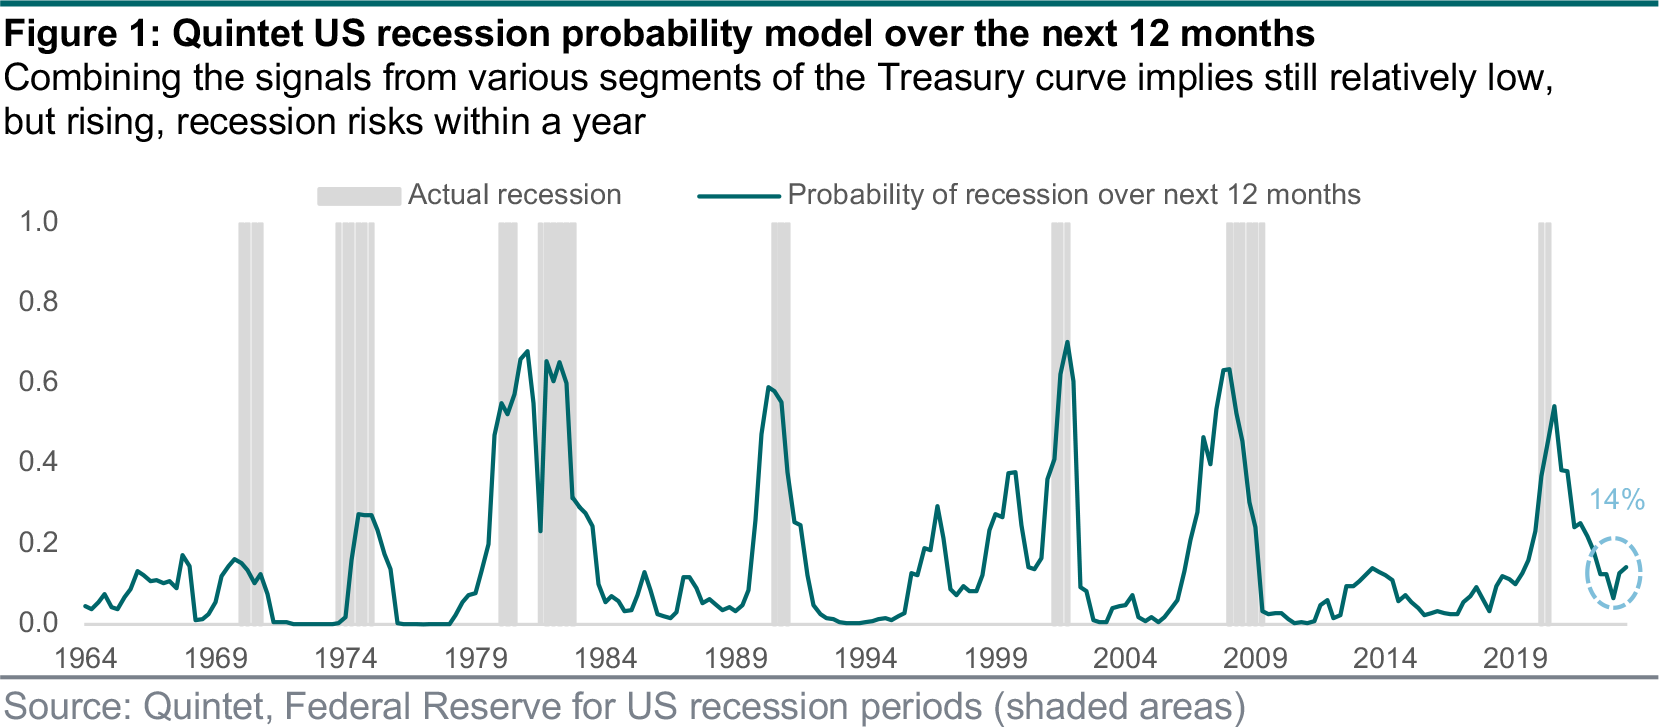
We use various versions of the yield curve, such as the difference between 10-year and 2-year nominal Treasury yields, the 10-year minus 3-month spread and several other measures to extract recession probabilities. We then combine them into a single probability, weighting each model according to how well it performs statistically. Our combined model suggests that the probability of a US recession (any recession, including just marginal contractions in GDP for two quarters in a row) over the next three to six months is practically negligible, rising to approximately 14% a year from now and doubling the year after. Along with our fundamental analysis, this is one of the reasons why a US recession isn’t our base case over our tactical asset allocation horizon (6-12 months).
The probabilities implied by most curve segments we examine imply a very low chance of recession over the next six months, and a somewhat higher probability over the next 12 months. The very steep front end of the curve implies almost no chance of recession, while the highest market- implied recession odds are from looking at the segments of the curve that are flat or inverted. The yield curve is usually upward sloping, whereby a higher fixed rate of return is earned from lending money for longer periods of time. Shorter-term yields tend to represent what investors believe will happen to central bank policies in the near future. Longer-dated maturities represent investors’ best guess at where inflation, growth and interest rates are headed over the medium to longer term.
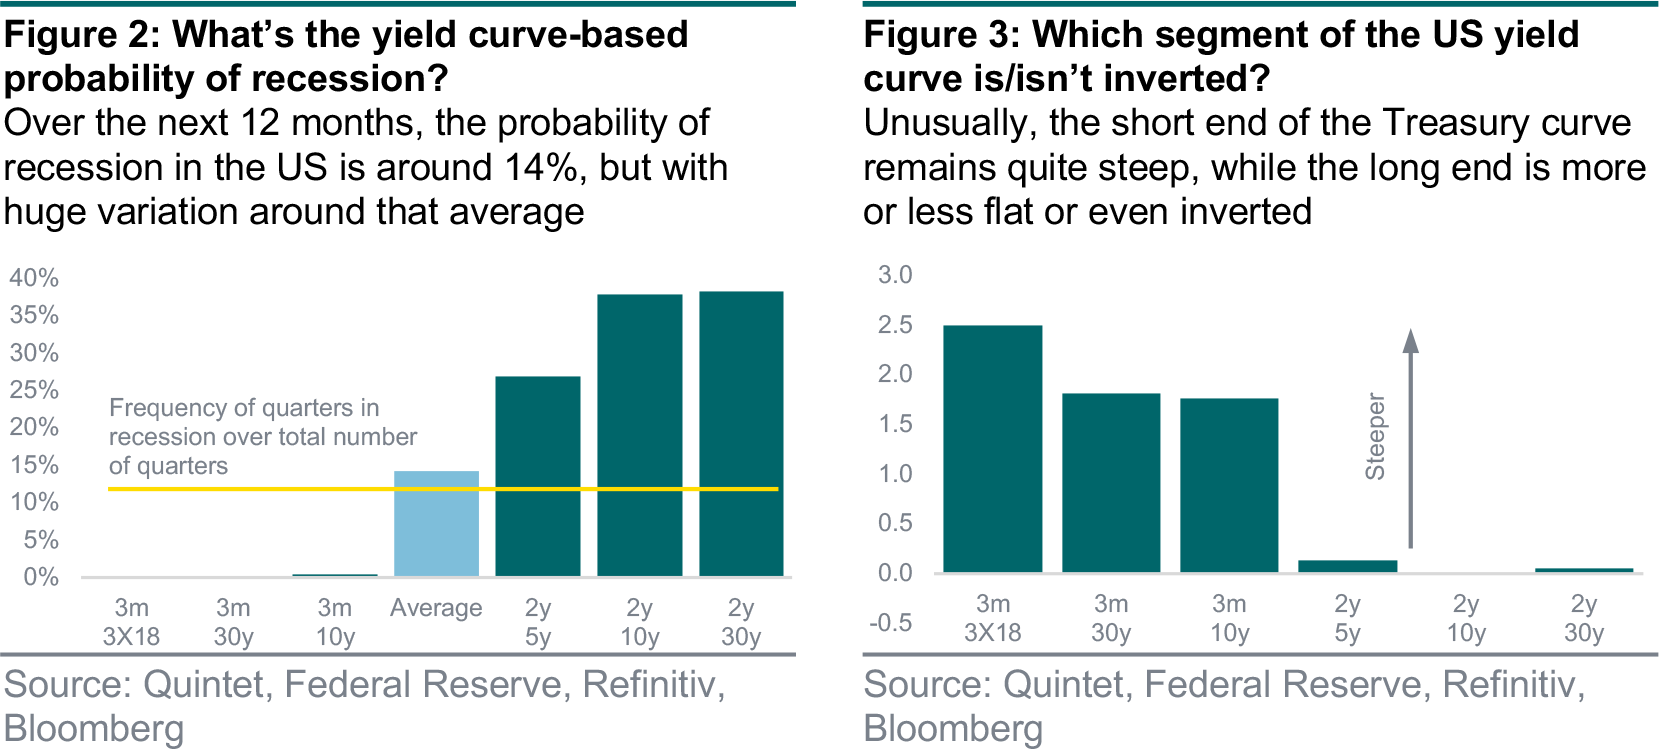
When growth and inflation expectations decline, yields on long-dated bonds tend to fall towards those of shorter maturities, as bond investors bet that central banks may need to encourage spending by lowering borrowing costs. When the curve inverts (when short-term bond yields are higher than long- term ones), investors sometimes take it as a recessionary signal. But the best signal comes from segments of the curve which, currently, aren’t inverted, as they focus on the near-term slope. This is potentially more informative because it proxies market expectations for the policy rate over shorter horizons and is less distorted by central banks’ balance sheets, which tend to lower long-term bond yields to a greater extent when central banks buy bonds, and vice versa when they no longer do.
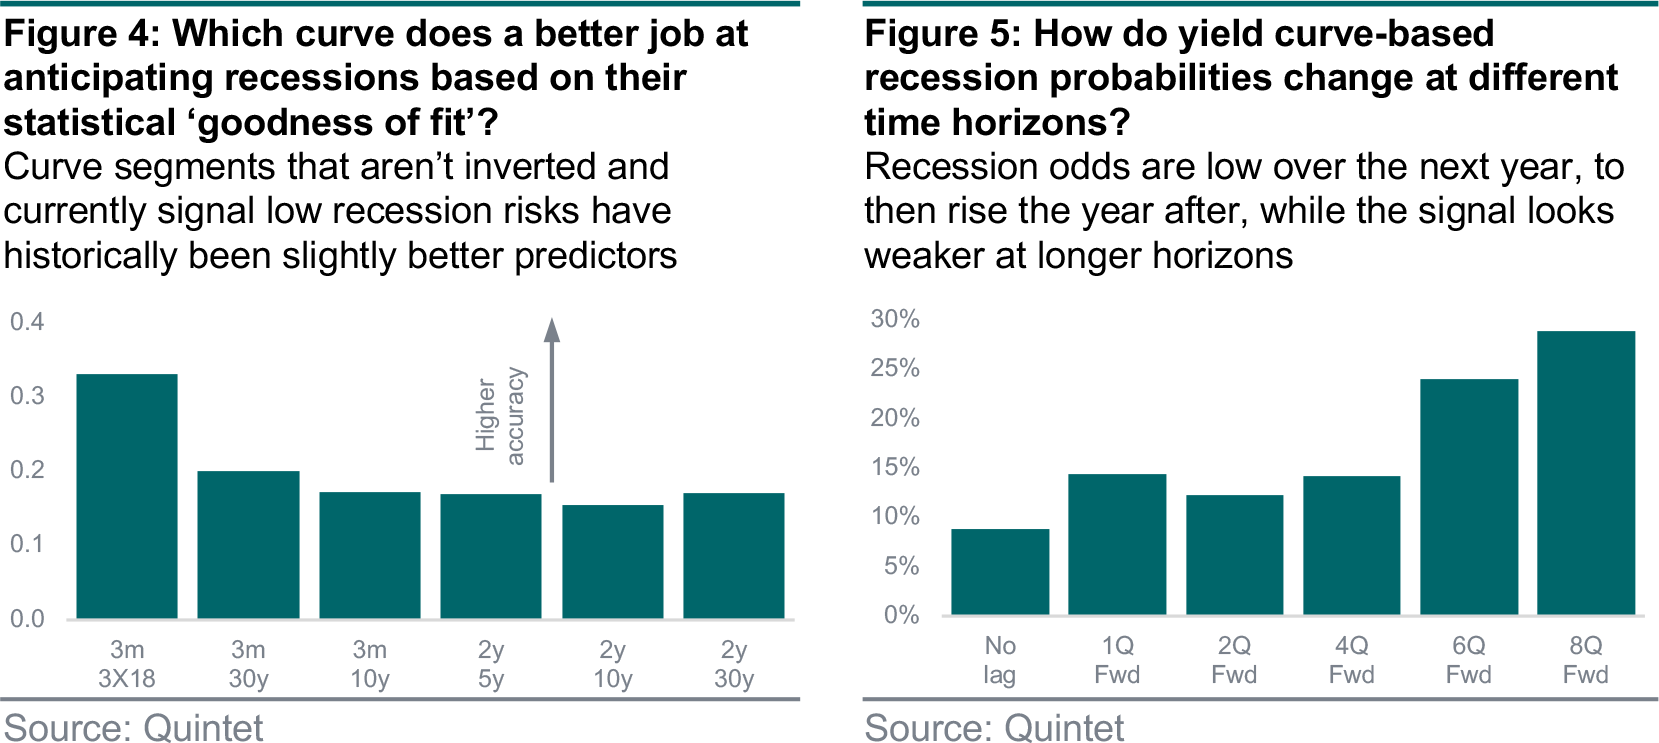
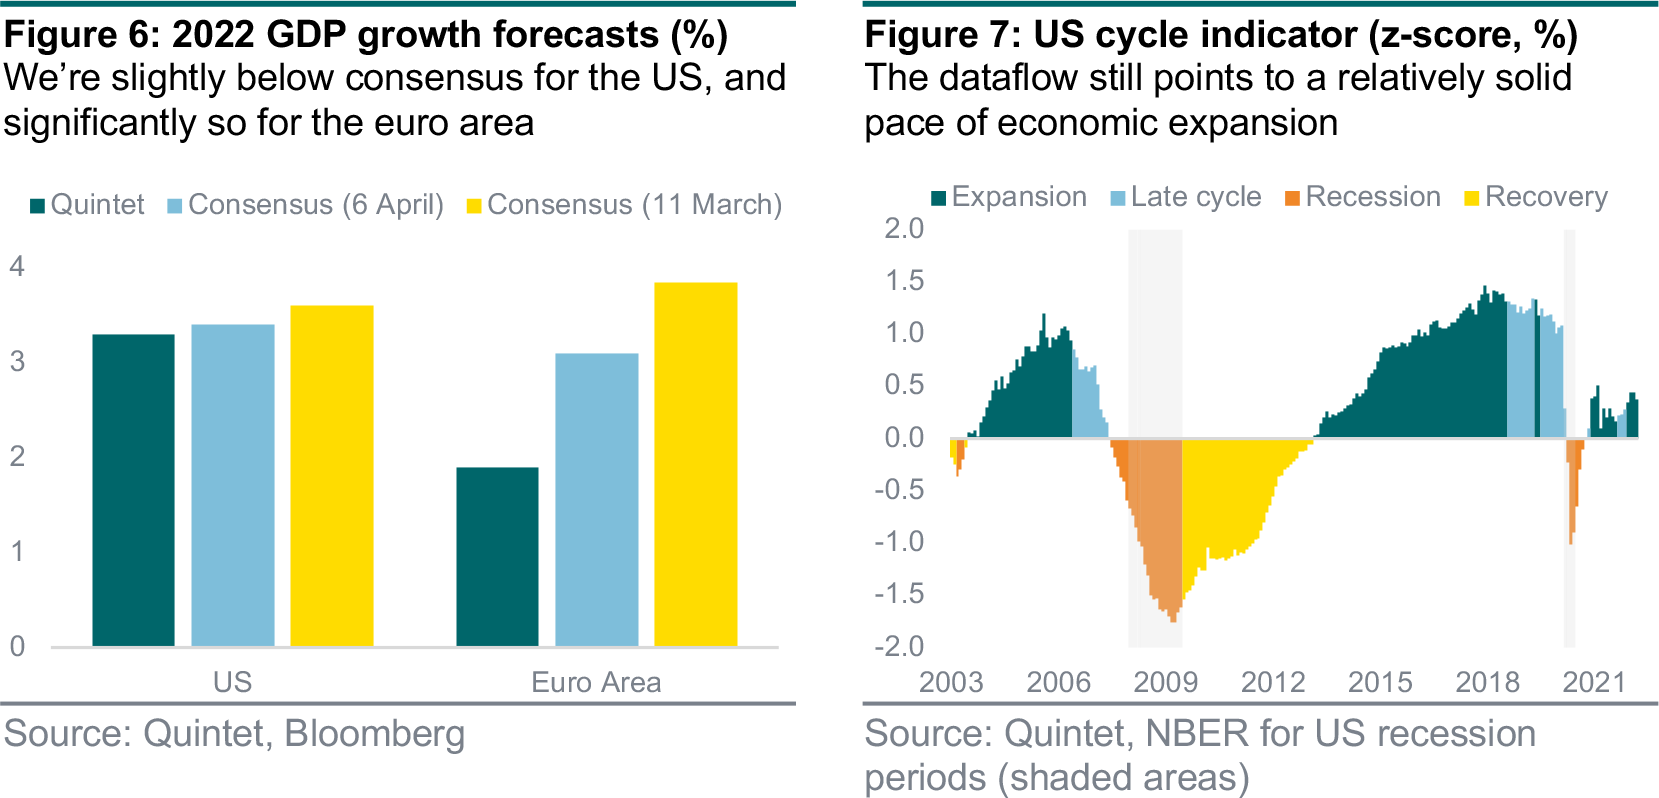
One caveat is that yield curve-based models don’t estimate recession probabilities as implied by economic fundamentals. Rather, they reflect the recession risk as priced by the bond market, regardless of whether that risk ultimately materialises or not. These models suggest that risks of a US recession, while still relatively low, are rising and, 18 months from now, could perhaps be higher relative to a typical year. If a recession were to occur, we think it would probably be mild by historical standards, as the US lacks the major financial imbalances that, generally, tend to exacerbate economic contractions. To reflect these risks, we’ve recently cut our growth forecast and are now below consensus – moderately for the US, where our cycle indicator remains in expansion, and significantly for the euro area.
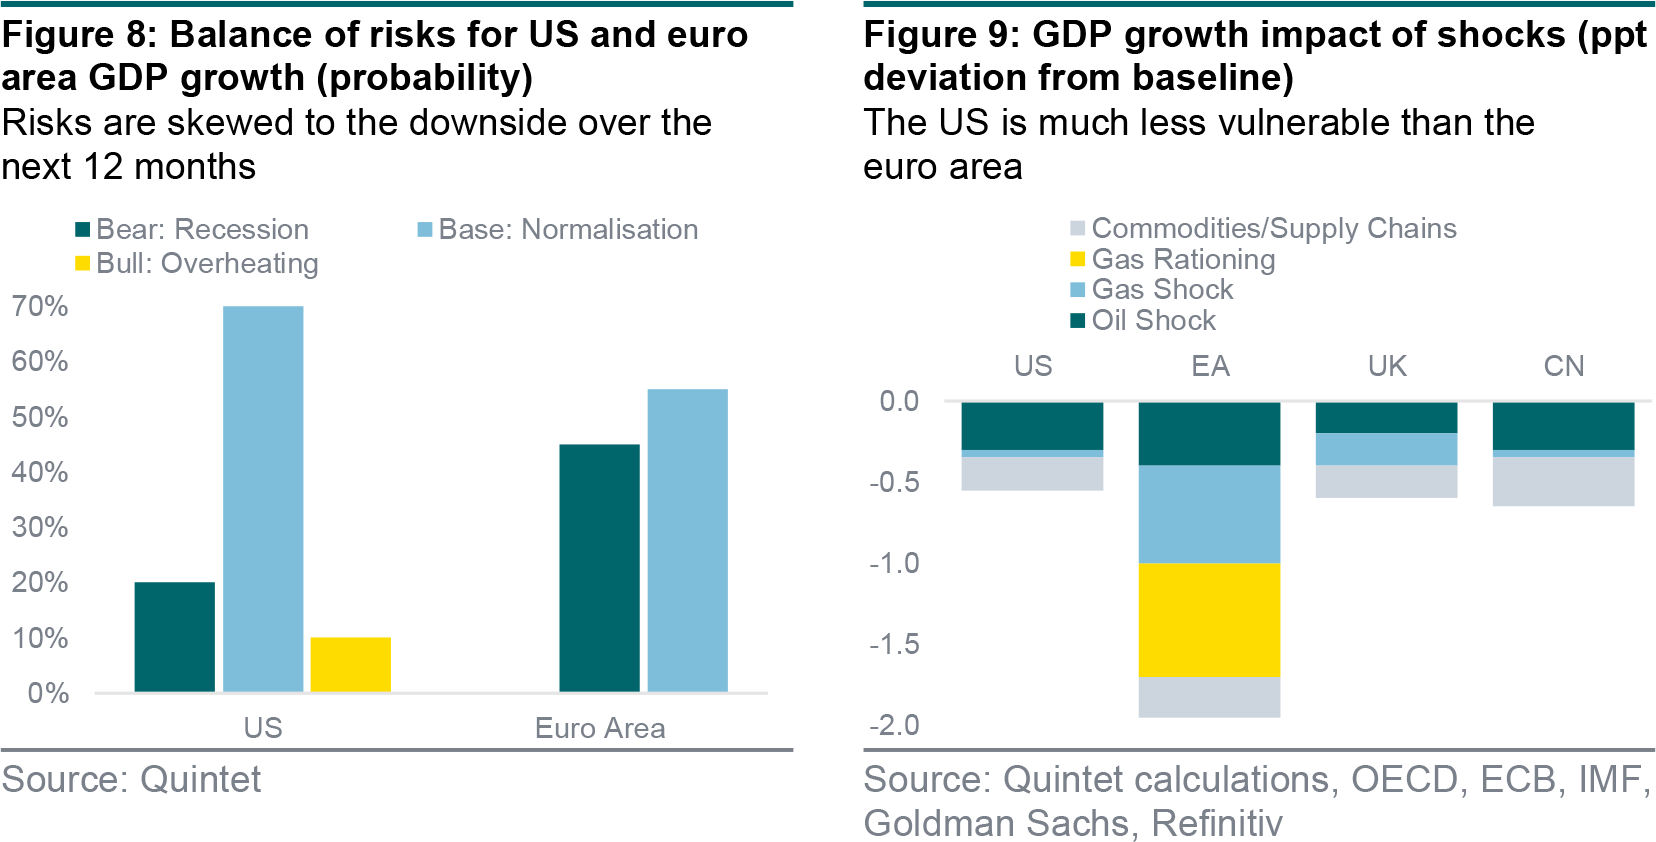
Also, we’ve recently changed the balance of risks to growth and think the bear case of US recession (20%) over 12 months is more likely than the bull case of overheating (10%). This means that it’s still more likely that there’s no recession (80% probability). This includes the probability of any recession, including very mild ones. In turn, this means that the probability of a deep recession, in our view, is much lower than 20%. To stress-test our assumptions, we’ve also sketched the impact of commodity price spikes, input shortages and supply-chain bottlenecks using a variety of econometric models. Figure 9 shows the impact of oil at USD 130 per barrel for a year, a 50% increase in gas prices and a 50% gas rationing from Russia, plus commodity/supply-chain strains.
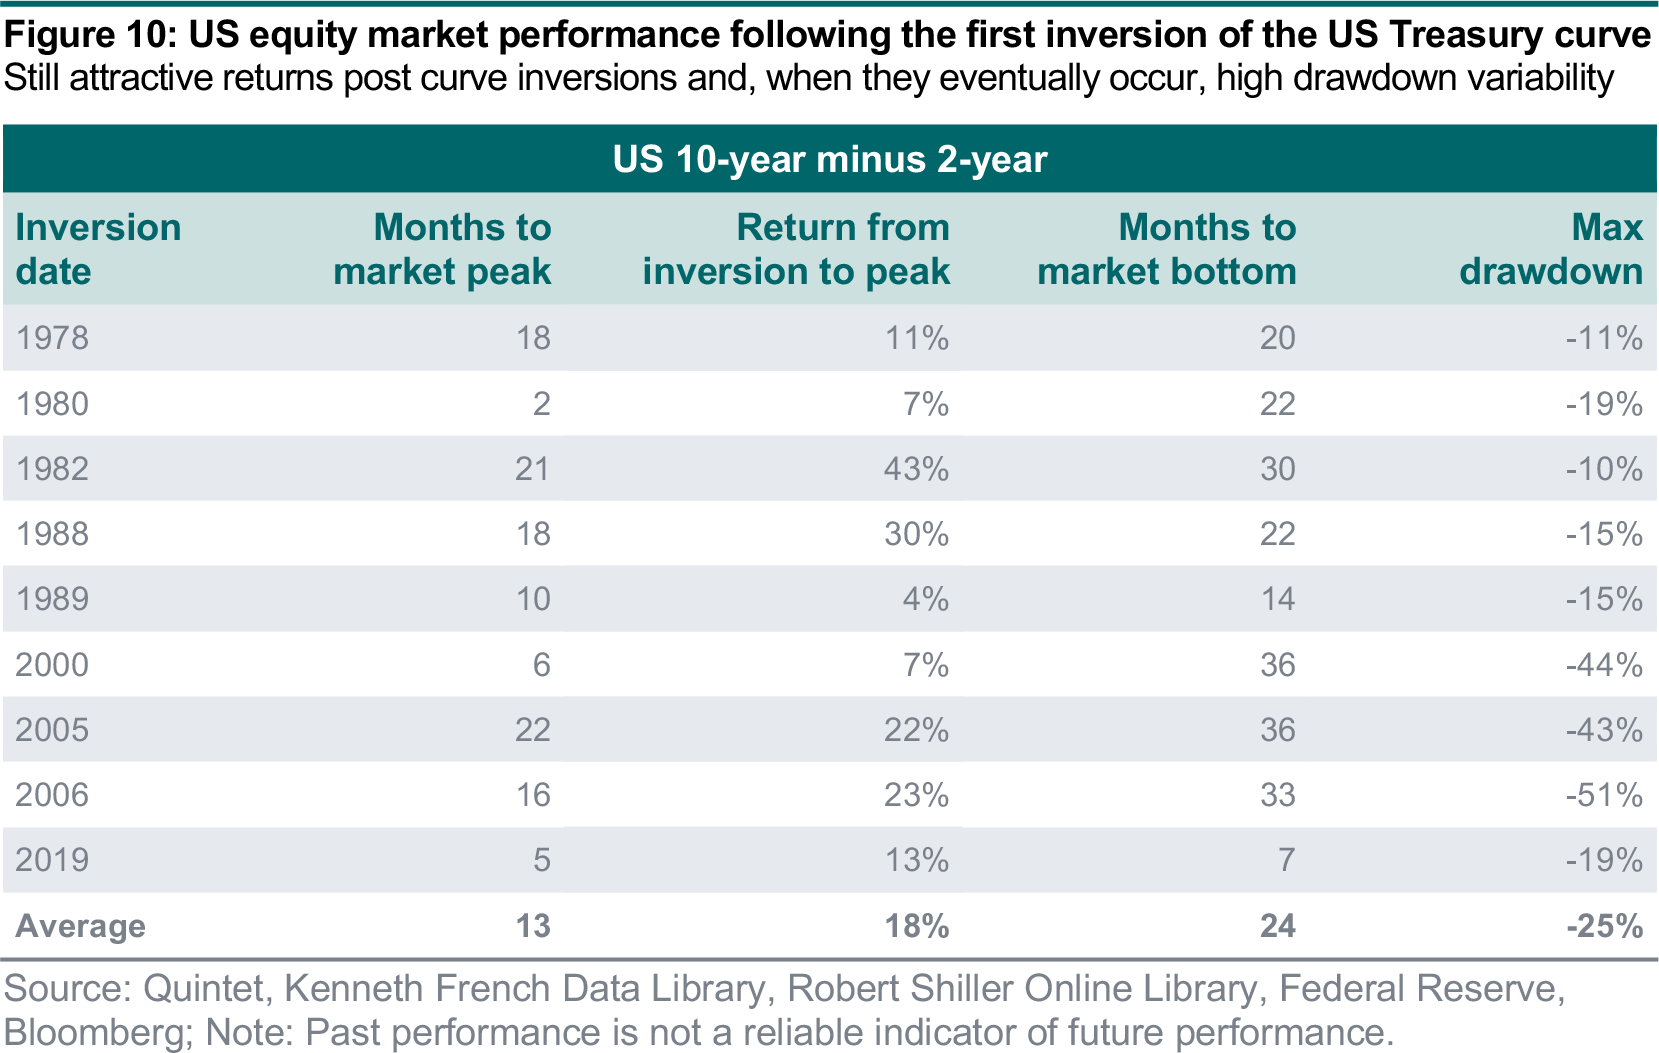
Our analysis shows that an inversion of the US yield curve isn’t a reliable timer of equity market returns. Historically, there has been high variability in the trajectory and size of equity market returns post a curve inversion. Figure 10 shows that, on average, it takes around 13 months after a yield curve inversion for equity markets to reach their peak. And the average return from equities remains appealing (18%) after the inversion date until the market peak. The other thing that becomes apparent when we look at the data is that there’s a large variability in the timing of market troughs. Following the curve inversion before the ‘dot-com bubble’ (2000) and the Global Financial Crisis (2005-06) the market had protracted and large drawdowns. In comparison, during many other periods (1978, 1982, 1989 and 2019) the market suffered only a short and sharp drawdown before recovering.
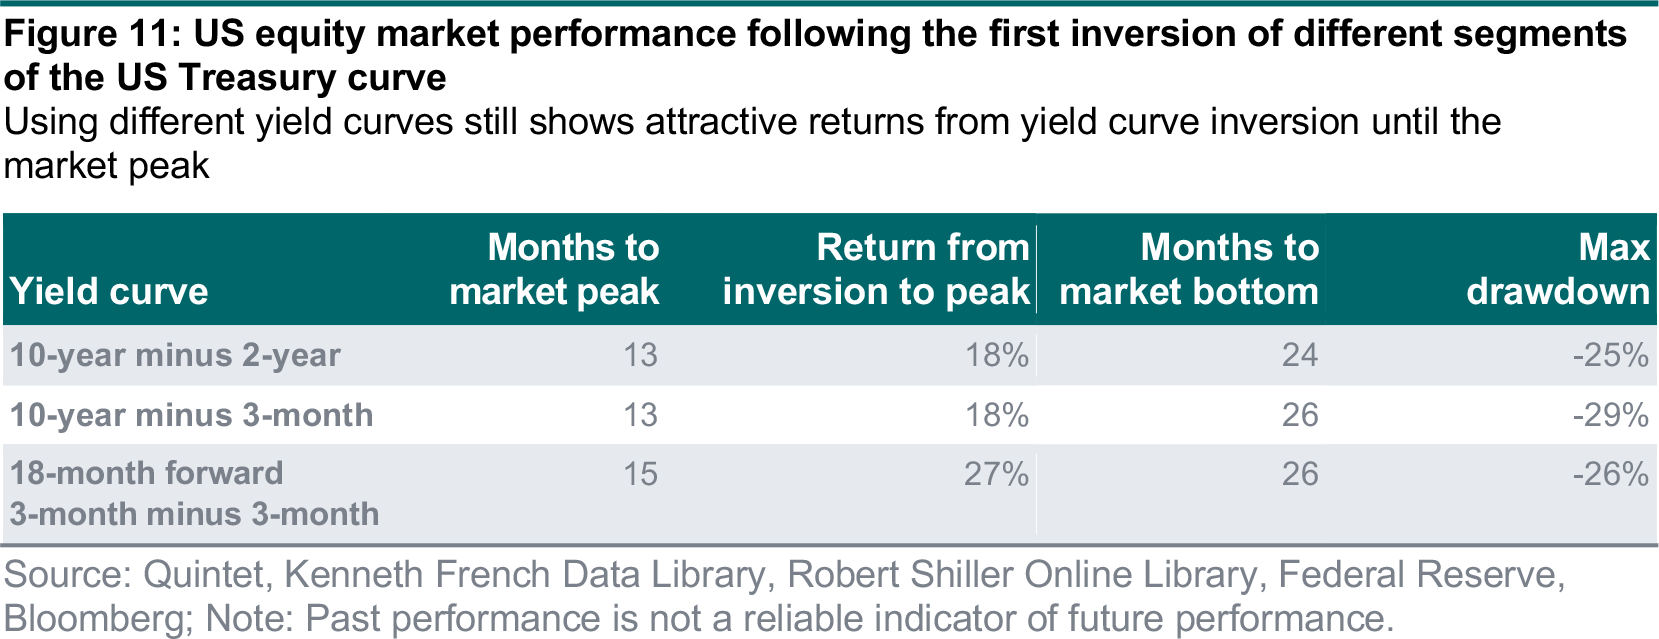
Extending our analysis, we find that the conclusions are insensitive to the selected curve segments. Figure 11 shows the same data using a mixture of short-term and long-term yield curve factors.
Irrespective of the curve we choose, we don’t find a higher likelihood of an imminent drawdown and all versions of our calculations show that equity returns on average remain attractive post inversion.
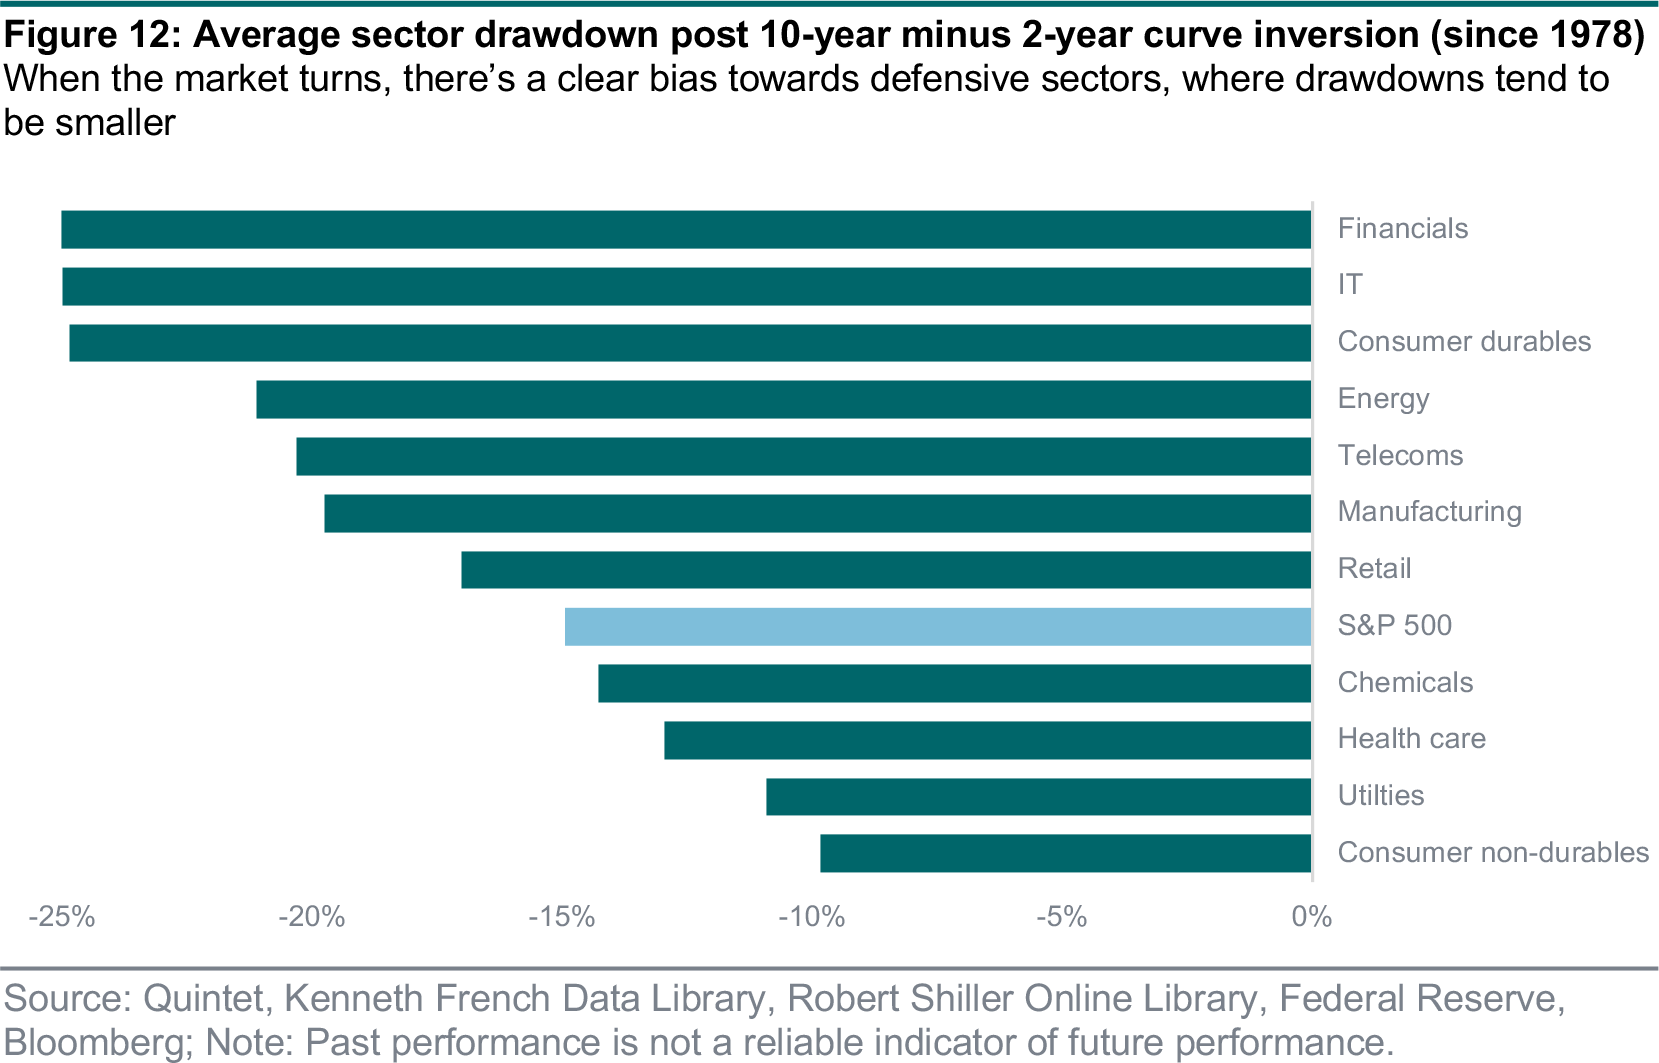
Beyond looking at the headline numbers, we can also assess the divergence in sector performance after inversion. We focus on the drawdown statistic, i.e., the return from peak to trough, as this is insensitive to when the market correction occurs. Figure 12 compares the average drawdown for each sector up to two years post inversion. The picture here is clear: when the market turns, there’s a bias towards defensive sectors such as utilities, consumer non-durables and health care over more cyclical sectors like energy, financials, tech and durable goods.
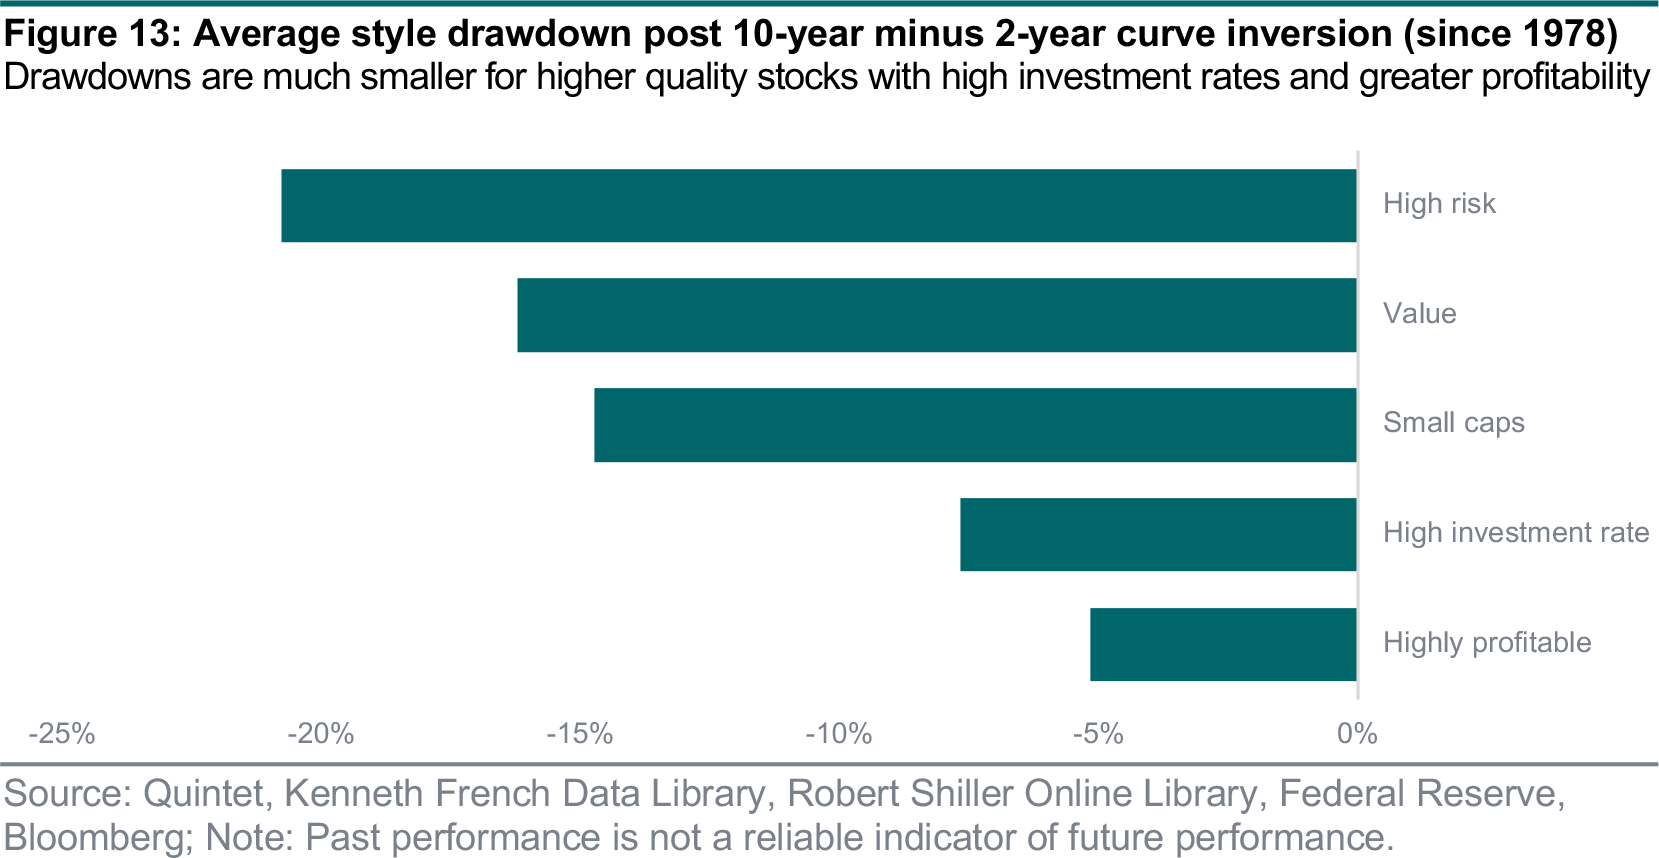
Another way of looking at equity markets is by assessing styles, i.e., grouping stocks based on a set of attributes, such as comparing small companies against big ones. Our analysis of style performance finds a picture that’s more or less consistent with our analysis of sector performance: riskier cohorts of stocks such as ‘high risk’, ‘small caps’ and ‘value’ (cheaper stocks) all suffer large drawdowns after curve inversions; conversely, drawdowns are much smaller for higher quality stocks with high investment rates and greater profitability.
Finally, we check whether an inverted yield curve has any ability in explaining changes to earnings growth expectations. If market participants viewed the yield curve as a key driver of global growth, then we would expect earnings forecasts to be downgraded after periods of inversion. This isn’t the case: an inversion of the yield curve has no discernible impact on the earnings outlook for any sector or, for that matter, the market as a whole. Additionally, we find that the level of the yield curve is a negligible driver of the earnings outlook.
The important message here is that the yield curve isn’t a reliable signal for when the market will turn or for earnings prospects. After inversions, if a recession does arrive, then riskier sectors and styles are more likely to suffer a larger drawdown. However, in isolation this isn’t a sufficient signal. This is why we look at a broad set of variables to determine our sector allocation, with a strong bias on the financial outlook for each sector and with a small weight to a broader set of macroeconomic indicators.
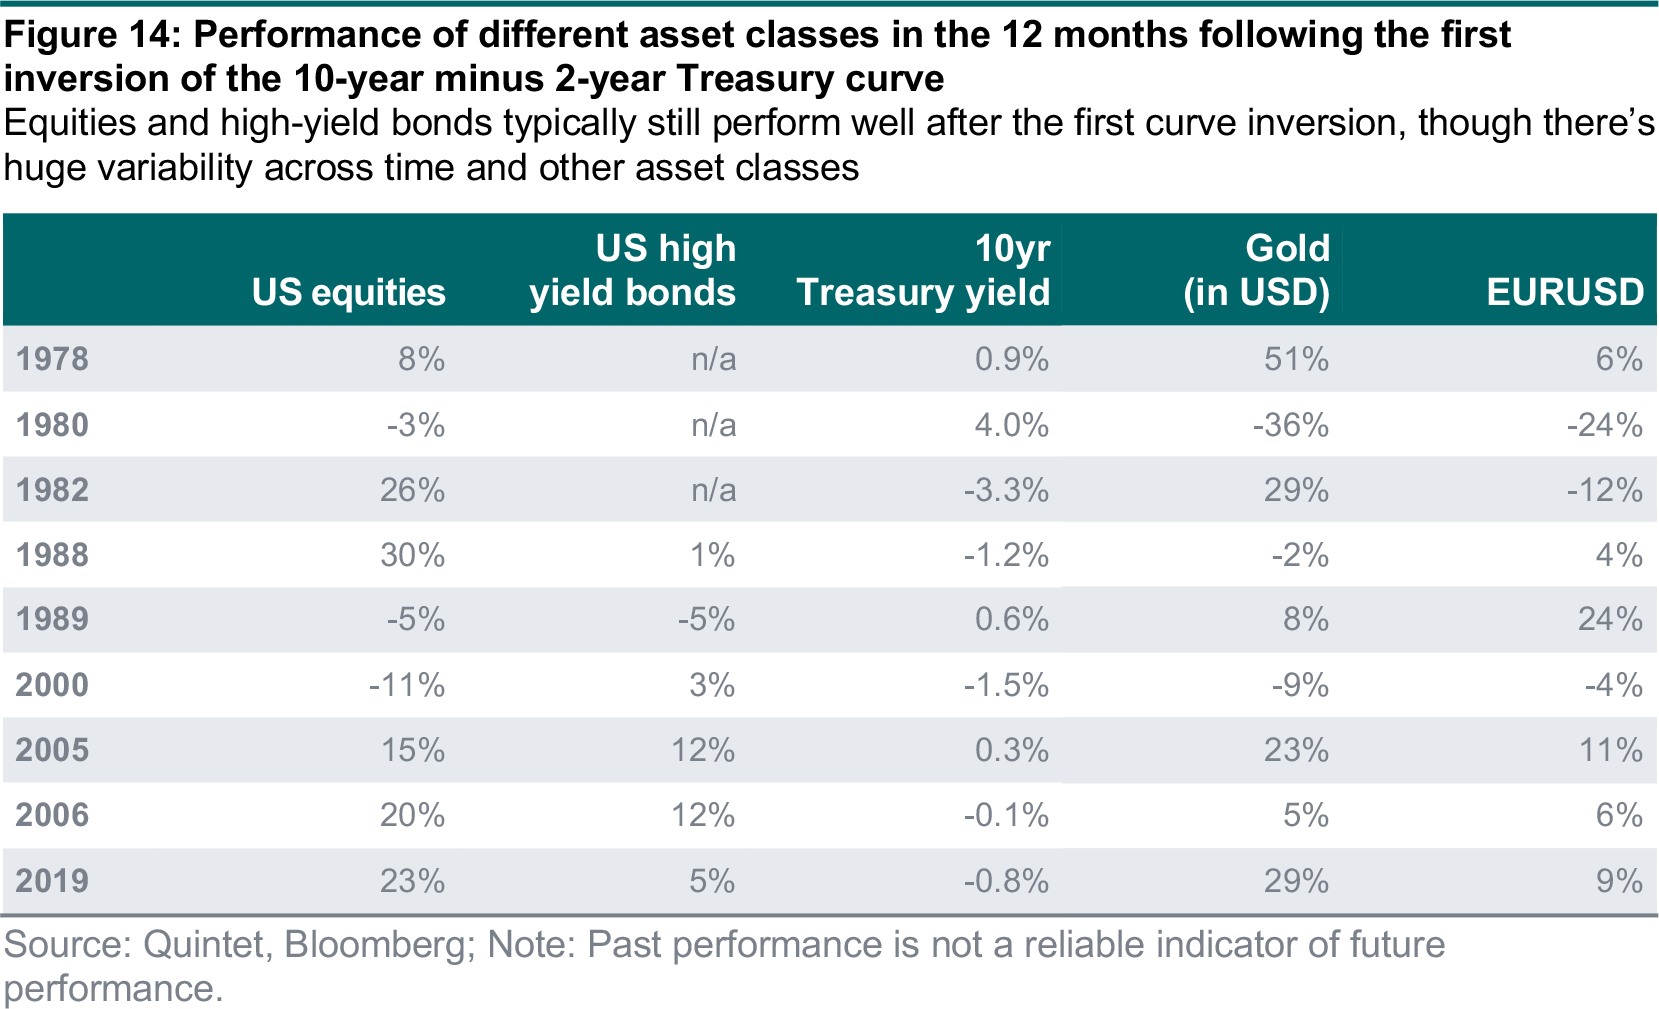
Beyond equities, our conclusion is consistent in terms of its limited ability to time tactical asset allocation decisions. Figure 14 shows asset class returns in the 12 months following the first yield curve inversion (10-year minus 2-year curve). Similarly to US equities, US high-yield bonds usually still perform well over that time horizon. The evidence is more mixed for other asset classes. Gold, for instance, often gains in the aftermath of curve inversions. But in two (of three) instances when stocks were down, gold sold off in tandem rather than providing protection (1980 and 2000).
In our tactical asset allocation, we keep a moderate risk-on stance overweighting US equities, Asia high-yield and emerging market sovereign bonds over government and investment-grade bonds. We also overweight emerging market over global stocks. The recent rise in yields has supported the performance of our bond/duration underweights, while risk assets have started to perform better since mid-March.
Authors:
- Daniele Antonucci Chief Economist & Macro Strategist
- Thomas Bilbé Equity Strategist
- Philip Odum Macro Strategist
- Philipp Schöttler Cross-Asset Strategist
- Bill Street Group Chief Investment Officer
This document has been prepared by Quintet Private Bank (Europe) S.A. The statements and views expressed in this document – based upon information from sources believed to be reliable – are those of Quintet Private Bank (Europe) S.A. as of 11 April 2022, and are subject to change. This document is of a general nature and does not constitute legal, accounting, tax or investment advice. All investors should keep in mind that past performance is no indication of future performance, and that the value of investments may go up or down. Changes in exchange rates may also cause the value of underlying investments to go up or down.
Copyright © Quintet Private Bank (Europe) S.A. 2022. All rights reserved.