


Should investors worry about inflation? Is the upcoming spike temporary, a longlasting trend leading to central banks hiking rates or are bond yields ultimately overreacting?
- Over the coming months, US inflation looks set to spike above 3% on the back of a range of statistical effects, rising oil prices and supply bottlenecks in the context of stronger demand as economies reopen. While the magnitude and duration is uncertain, this rise looks temporary to us. We expect a subsequent inflation slowdown to just above 2% in early 2022.
- Labour markets are only likely to put upward pressure on inflation gradually, which is why we think the major central banks won’t tighten their policies for quite a while. Further out, technological and demographic factors may turn out to be disinflationary forces.
- We expect bond yields to rise gradually and less than in past early-cycle recoveries, with curves steepening as central banks anchor short-end rates and let longer-dated ones rise as long as it’s because of faster growth. We have changed our US dollar call and now project it to strengthen versus the euro – given more US fiscal stimulus and faster vaccine rollouts.
- We now expect US 10-year yields to range between 1.75% and 2% in the fourth quarter of 2021. We still expect negative real rates (which are stimulative) and central banks to keep government funding costs in check to make fiscal stimulus affordable. Oil prices have scope to rise further. Cyclical stocks, sectors and investment styles should stay supported.
At the most basic level, inflation is generated in two ways. When the unemployment rate is lower than its ‘natural’ rate, labour shortages can occur. If companies increase wages to attract workers, this pushes production costs higher. If they raise prices too, cost-push inflation occurs. When unemployment is low and wages are rising, demand for goods and services increases too, and consumers are willing to pay more – especially if supply is slow to adjust. The result is higher prices due to demand-pull inflation.
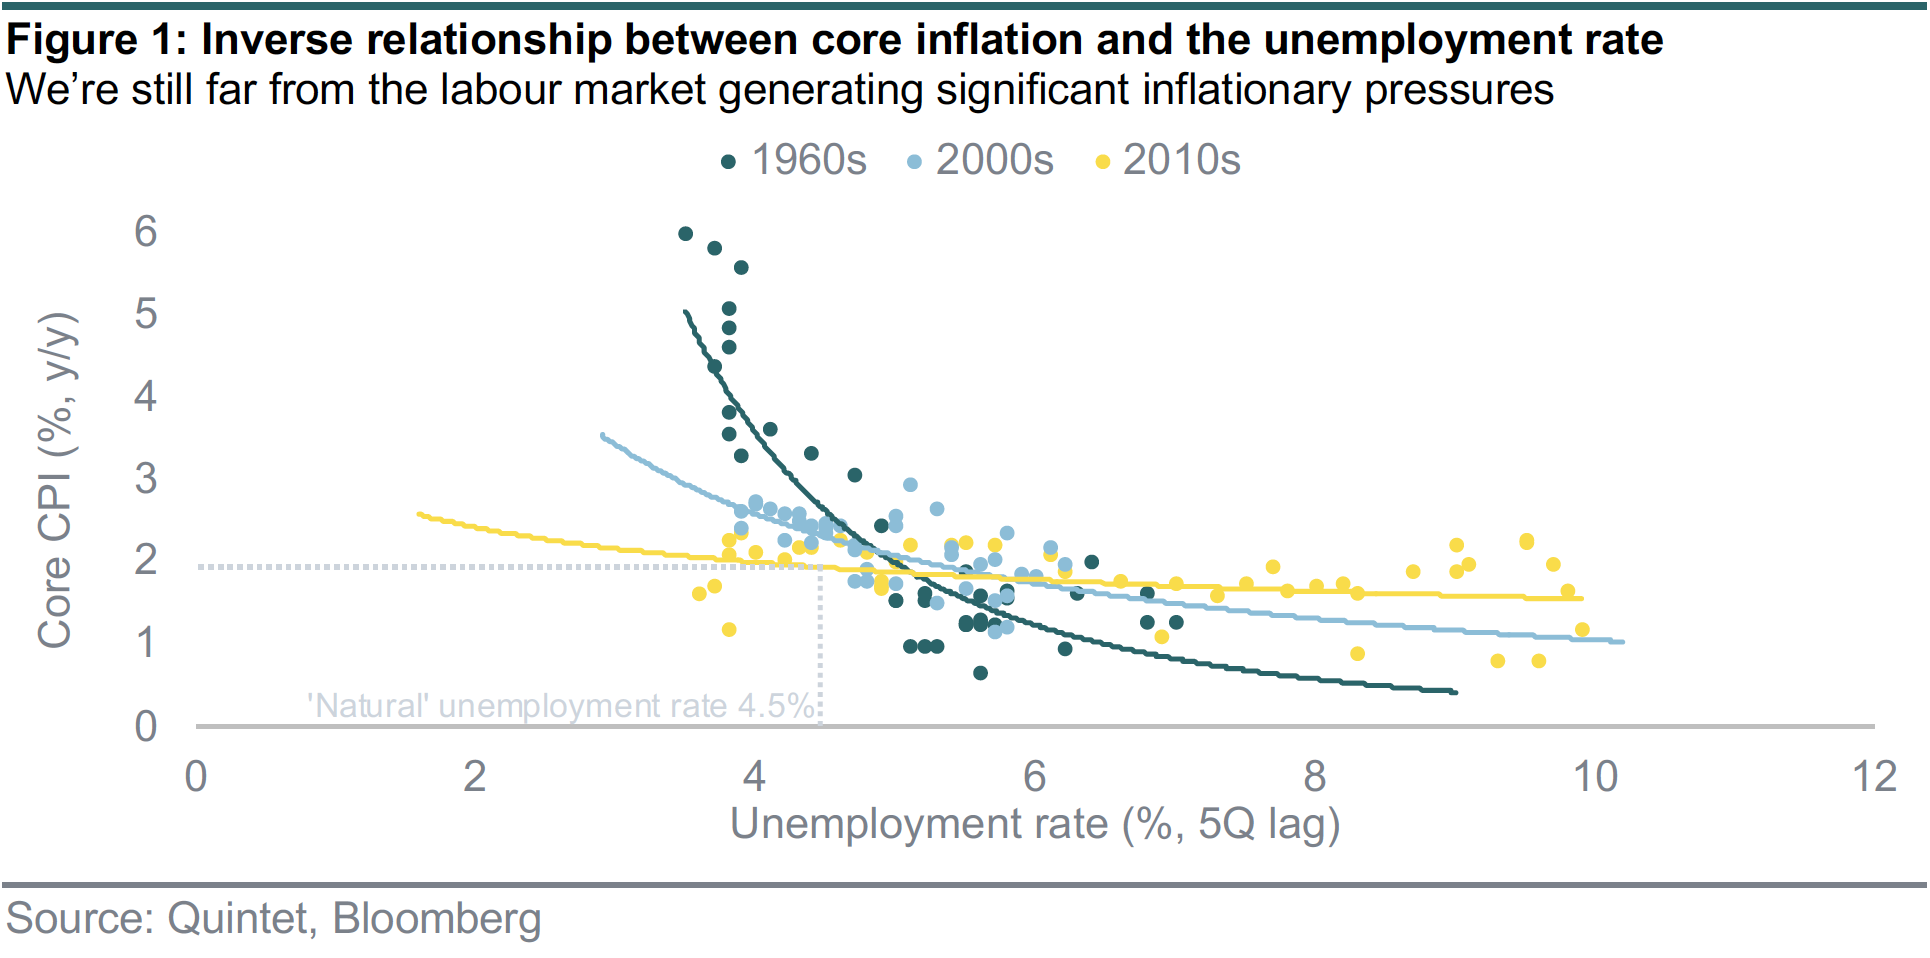
The inverse relationship between the unemployment rate and core inflation – known as the Phillips curve – is unstable over time. Expectations of higher inflation can become a self-fulfilling prophecy and perpetuate any inflation rise, and vice versa. As it turns out, central banks’ credibility as inflation fighters has ‘flattened’ this relationship. In the 1960s and 1970s, a given level of unemployment rate tended to correspond to a higher inflation rate than today – a trend that’s possibly been reinforced by a prolonged period of low inflation (figure 1).
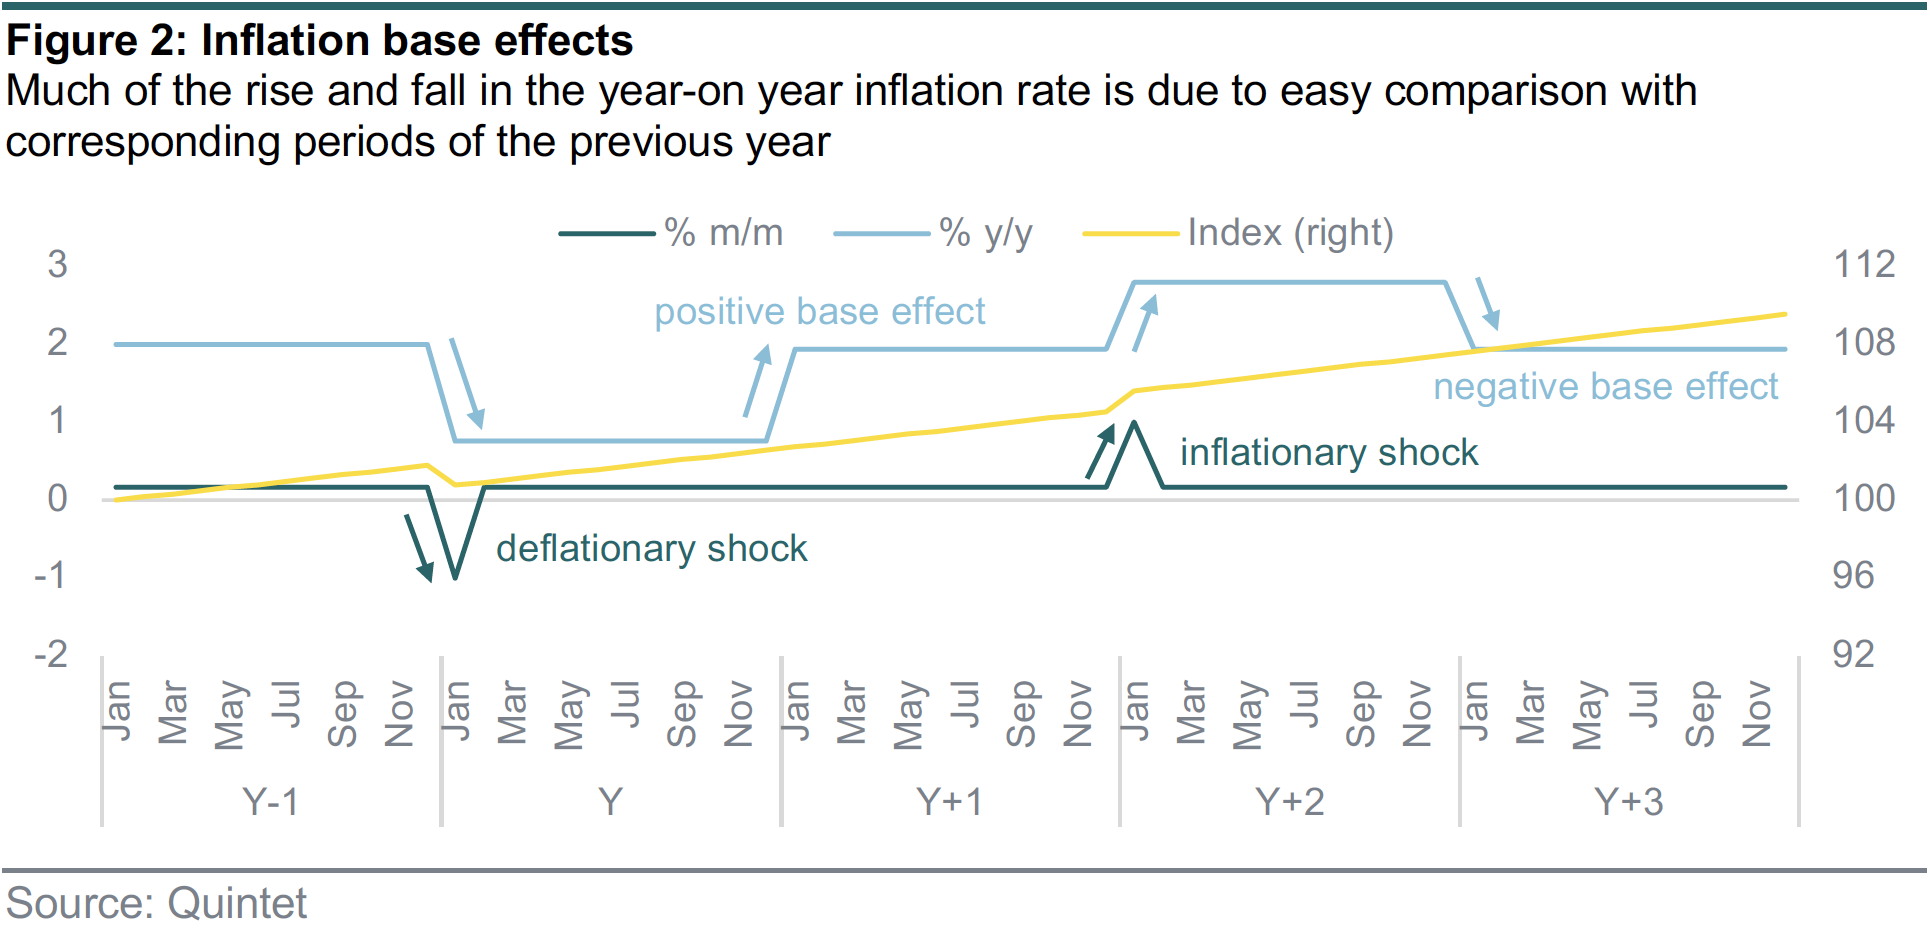
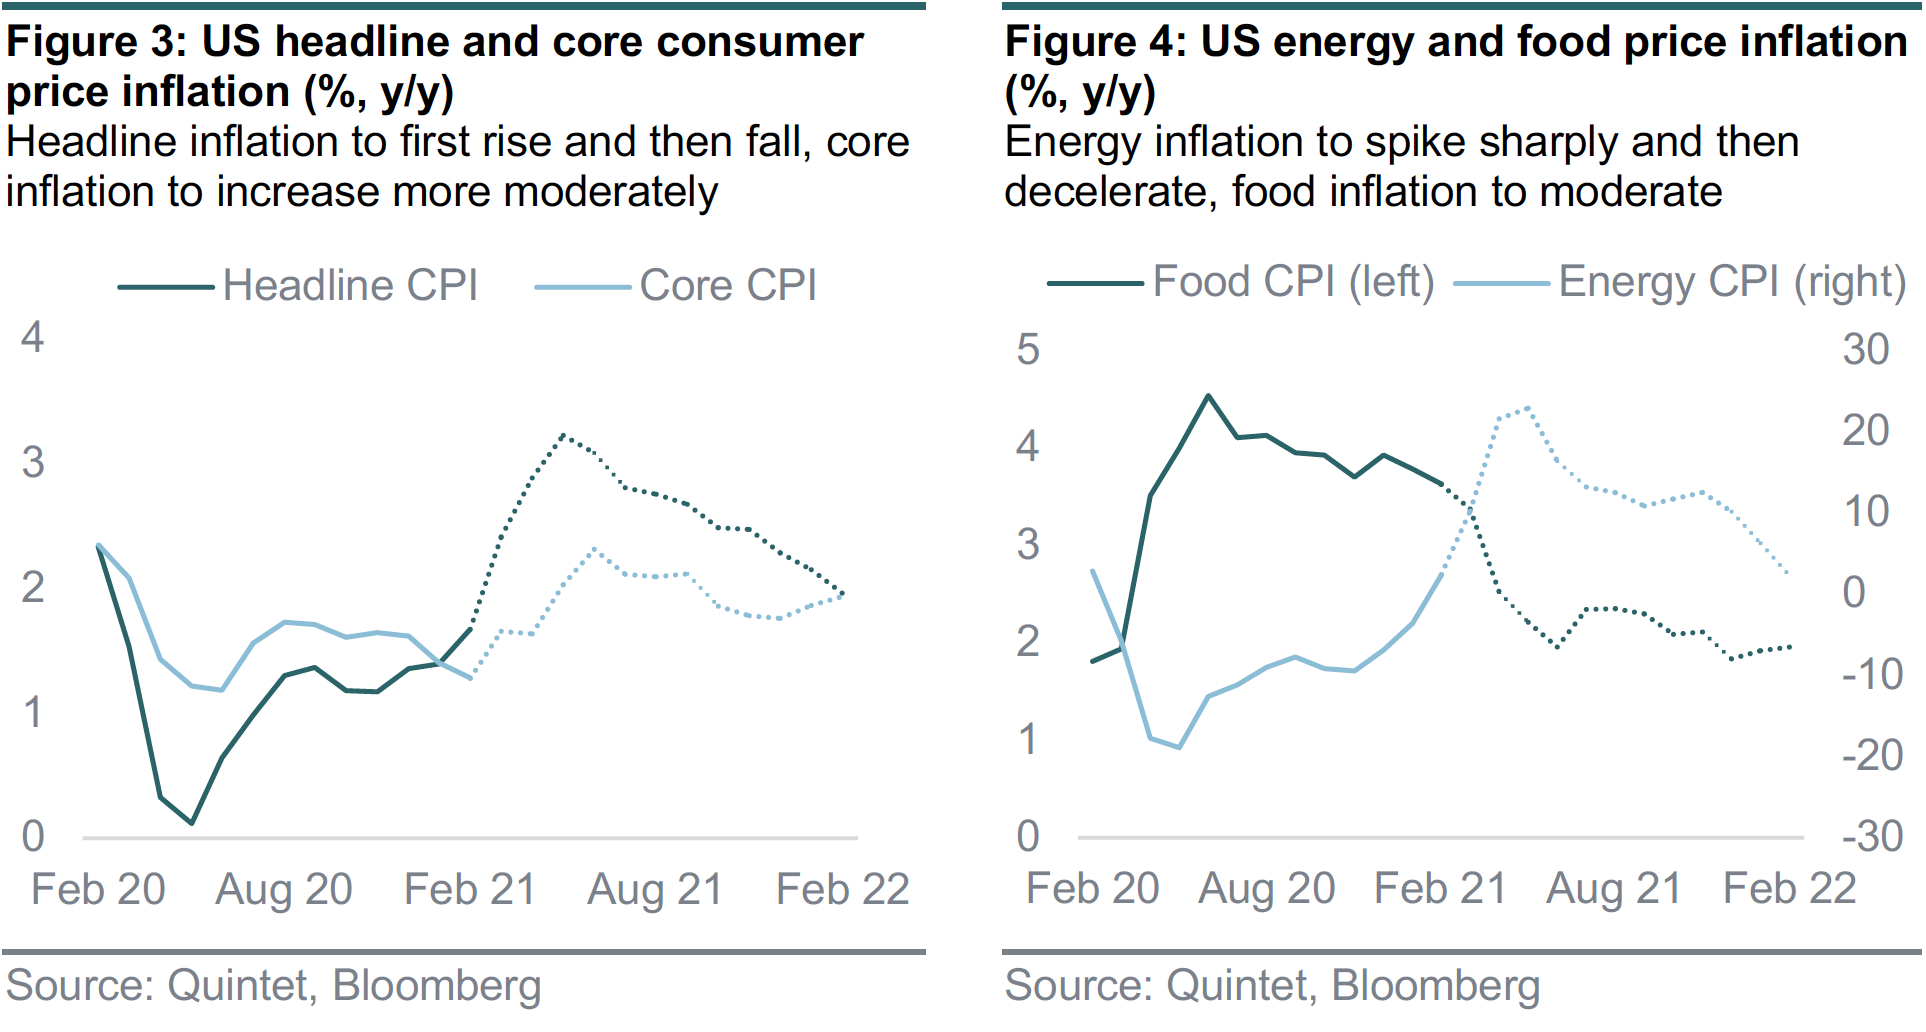
We think US consumer price inflation is set to accelerate to more than 3% year-on-year in the second quarter. However, we expect it to fall back to just above 2% or so 12 months later. This is because much of the rise is due to the comparison with the pandemic-induced fall in prices this time last year. Figure 2 shows an example where the month-on-month inflation rate is a small number every month except in January of year Y when, owing to a one-off event such as a lockdown, it falls to -1%. Inflation calculated in year-on-year terms then slows down for one year until the deflationary effect drops out of the year-on-year comparison and, all else being equal, it goes back to the pre-shock year-on-year inflation rate in January Y+1. An inflationary shock has the opposite effect.
Of course, things are rarely all else being equal in the real world. Oil prices have risen since – and we now project a further pickup to USD 75 per barrel at year-end. But, unless one assumes everincreasing oil prices, this effect too, at some point, drops out of the year-on-year comparison. We build a model that takes drivers like these into account but, crucially, also projects the core inflation rate based on a gradual improvement in the unemployment rate and wage growth, anchored consumer inflation expectations and a moderate feedthrough of producer prices. This model suggests that underlying inflation should pick up too, but slowly, and range between the current rate of 1.5% and about 2% over the next year – still below the Fed target (figure 3).
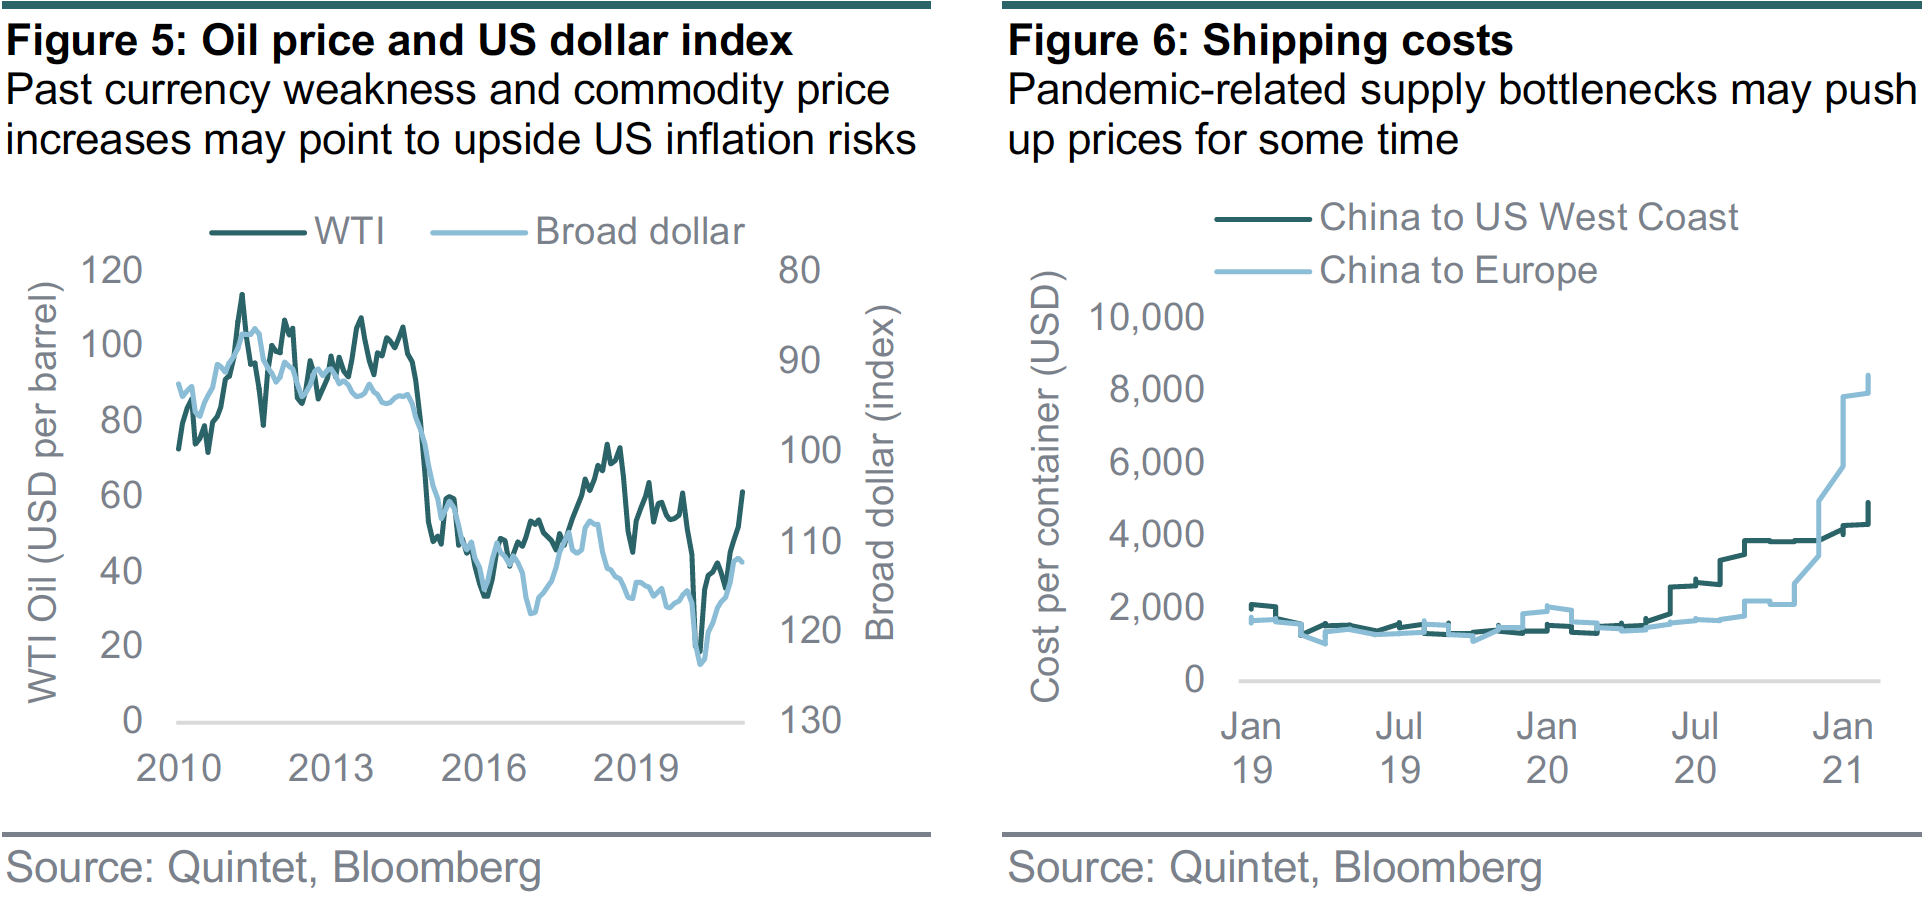
While our model performs well in terms of projecting overall inflation trends and their seasonal patterns, calibrating these forecasts month after month is harder. It’s possible that the pass-through of past dollar weakness and higher oil prices is more rapid than expected. However, the dollar has strengthened recently and we believe that the biggest jump in oil prices is behind us (figure 5) – although stronger demand on the back of reopening and supply restrictions implemented by OPEC+ are still likely to drive oil prices somewhat higher from here. More uncertain is the impact of a shortage in processing capacity at ports, as well as limited availability of shipping containers. This has led to a surge in shipping costs from China to the US and Europe (figure 6). If sustained, these higher costs may partially be passed on to consumers. We bias our forecasts upwards to account for these price pressures – and for the impact of weather on food prices – but this calibration exercise is imprecise.
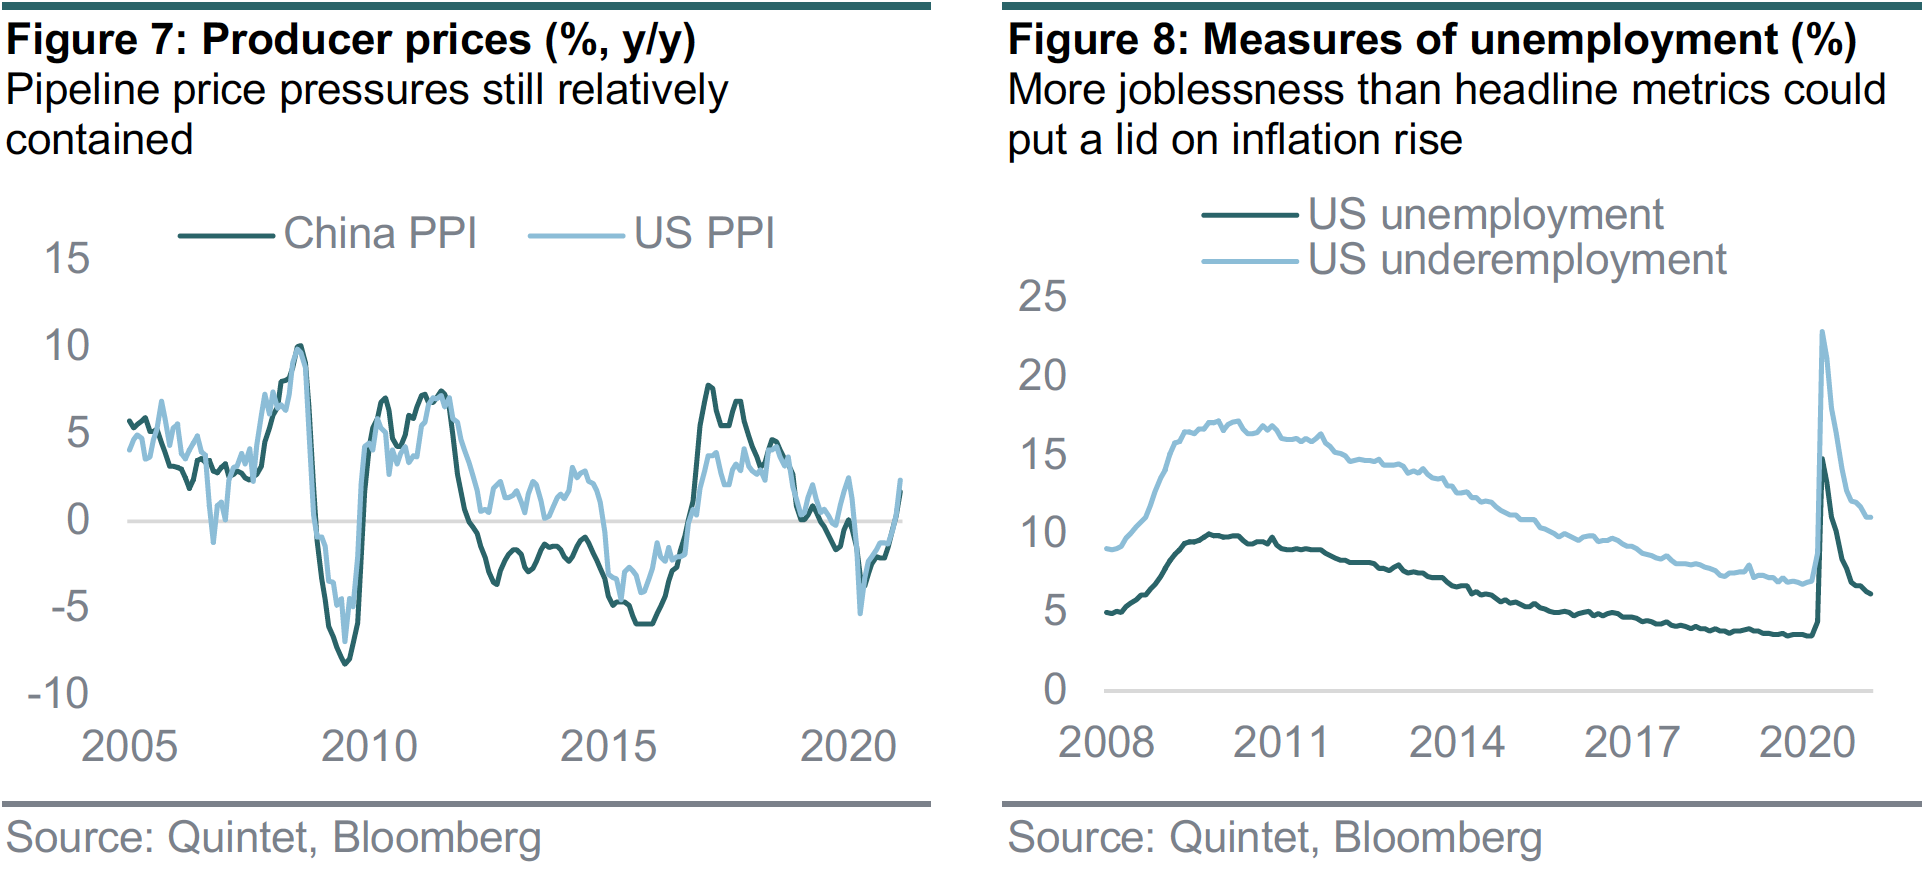
How much these lagged and temporary effects feed through and, ultimately, impact producer and consumer prices remains to be seen. For now, it looks as if producers are willing and able to absorb these costs via margin compression – at least in part. China’s producer prices, which are important for global supply chains, have risen, but their pace of increase is now merely in line with the longterm average. US producer prices have picked up too, although the current rate is well below past peaks (figure 7). Importantly, whether any current or future pipeline price pressure eventually translates into a faster pace of consumer price increases depends on whether firms believe the consumer is able to withstand a higher bill. From this perspective, even though it’s getting better across all measures, we think the headline unemployment rate underestimates the degree of slack in the economy. Accounting for ‘underemployment’, joblessness is much higher – which should mitigate any upward pressure (figure 8).
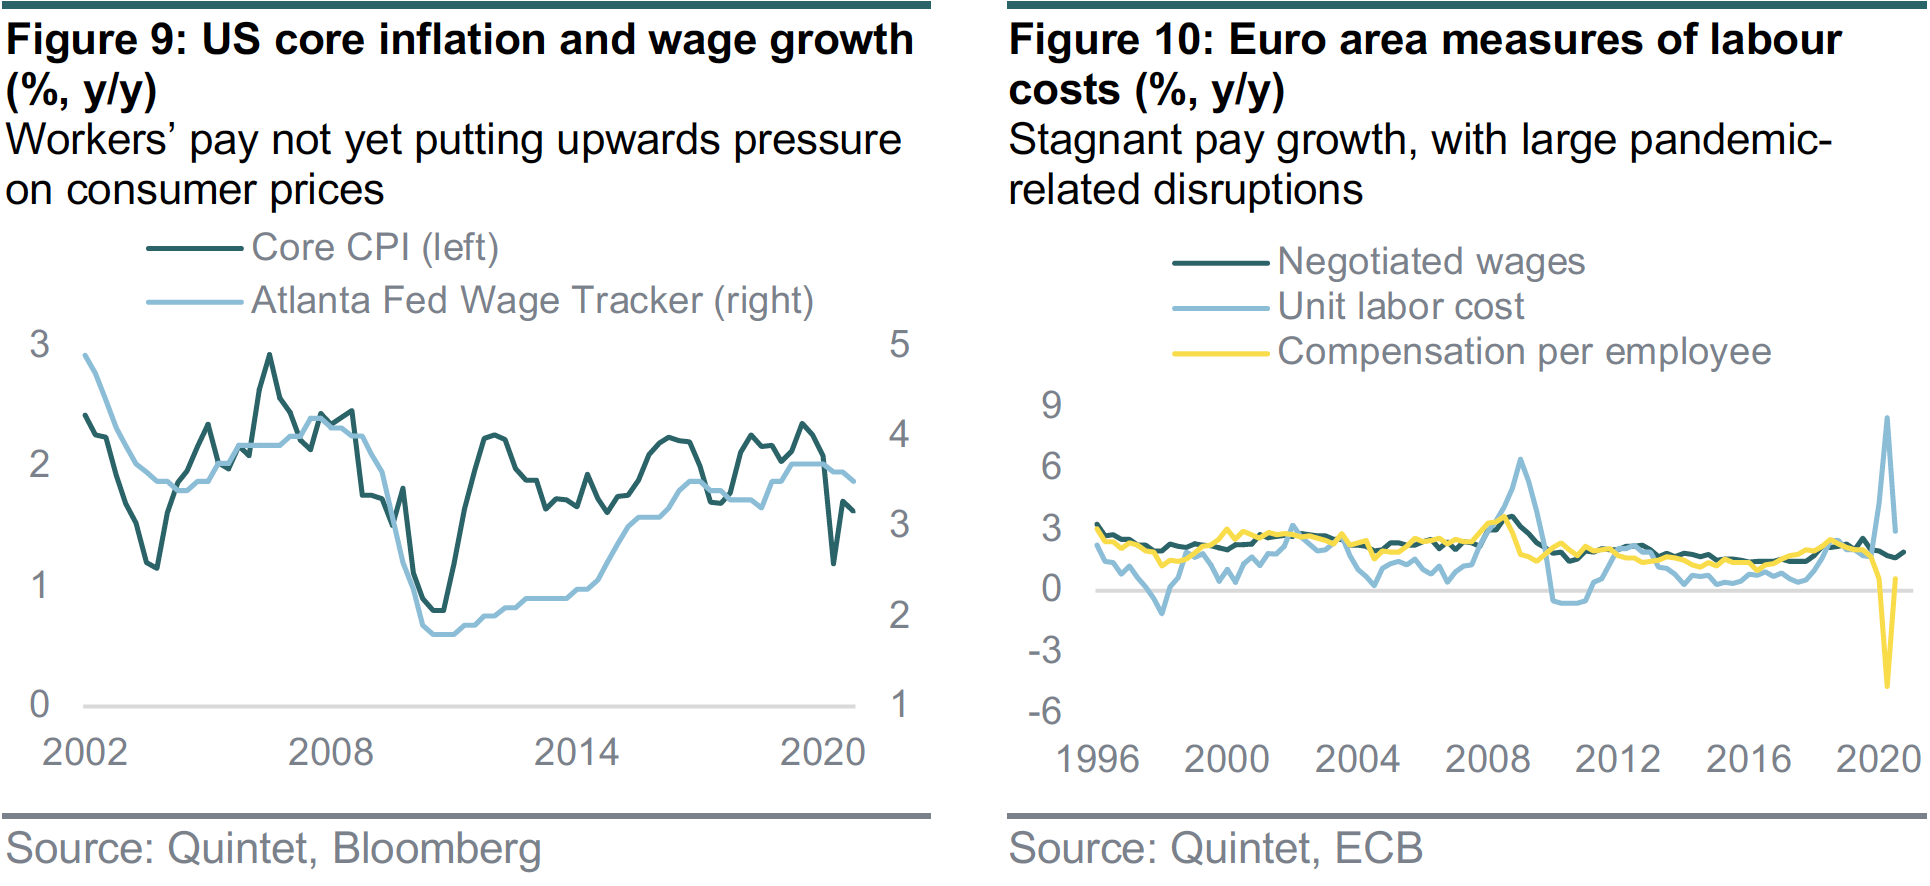
Even though we expect US inflation to spike in the second quarter of this year and then get back to target towards late 2021 and early 2022, we don’t think we’ll revisit the low levels of inflation (and bond yields) seen during the pandemic. But we believe that, for a fundamental boost to core inflation, we’ll need to see a pickup in wage growth (figure 9). At this stage, given the existing slack, we expect that the labour market will have to tighten a great deal before we eventually get there. With a still large share of the workers who lost their jobs during the recession still unemployed, and elevated year-on-year rates of growth in long-term unemployment, it’s not surprising that wage pressures have been minimal. The Atlanta Fed’s wage growth tracker has remained range-bound during the recession and the recovery so far. Additionally, the employment cost index rolled over in 2020 and, at 2.5%, currently suggests a lack of significant core inflation pressure. In the euro area, unsurprisingly, wage pressures are muted as well (figure 10).
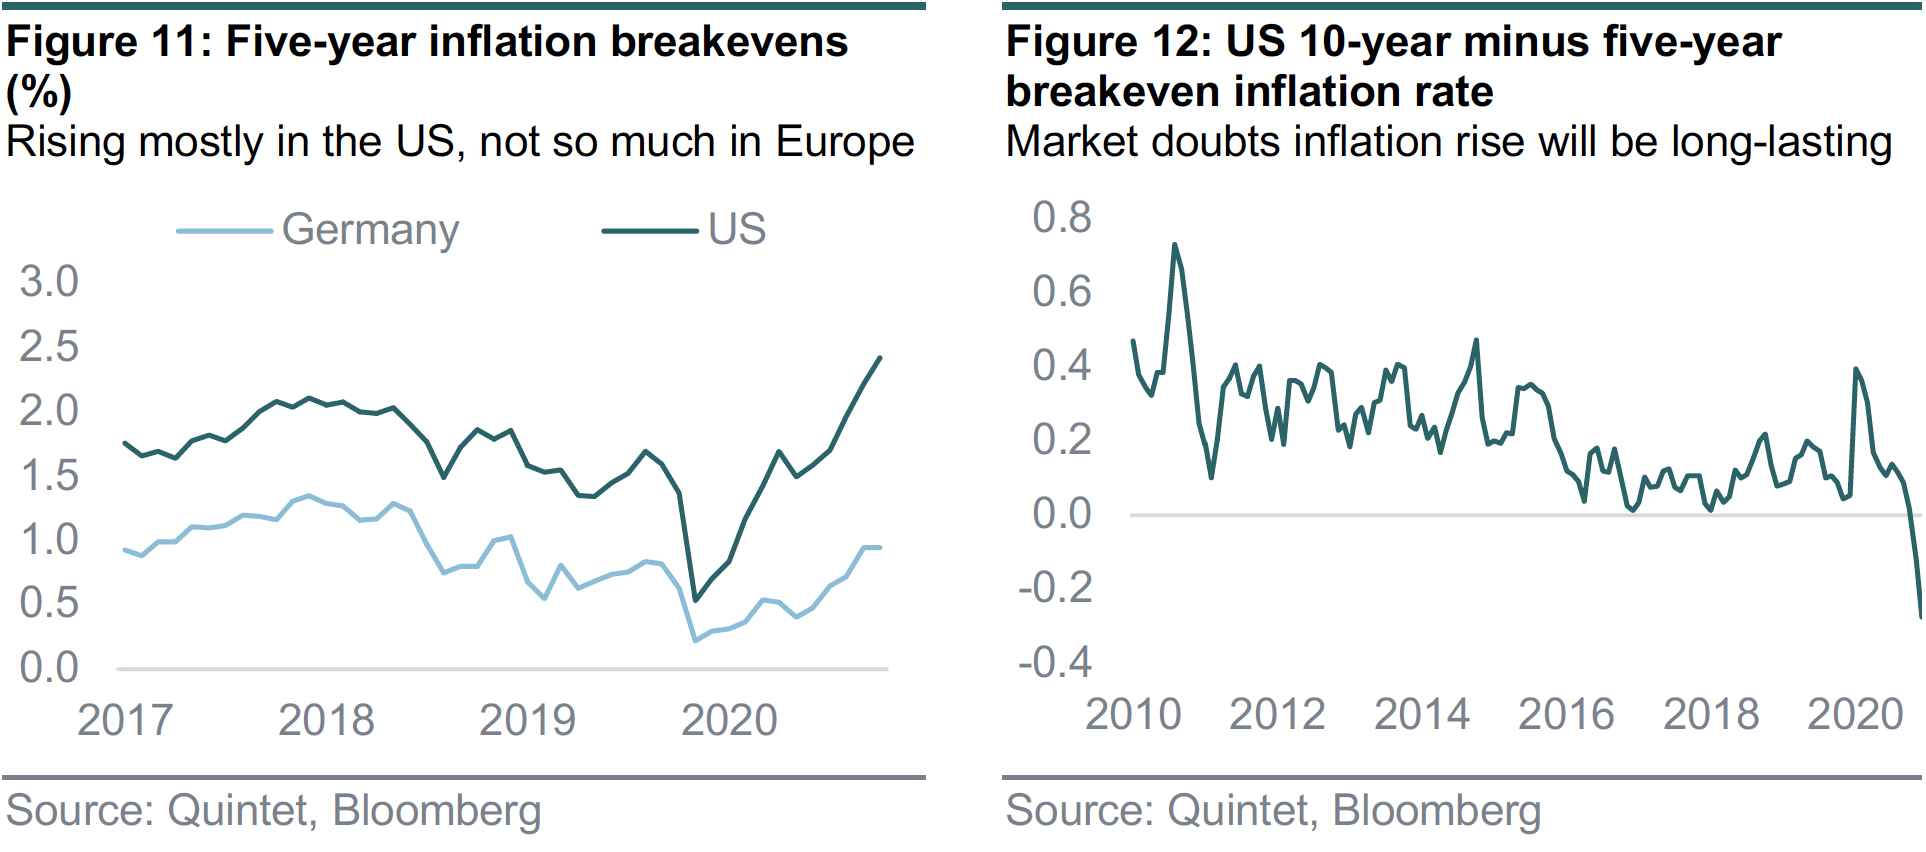
Market-based inflation expectations have moved higher both in the US and in Europe – though they’re now at a relatively high level in the former and remain rather low in the latter. Survey-based measures of inflation expectations have adjusted to a lesser degree. We believe that, as spare capacity diminishes over time and the cycle matures, inflation expectations will likely stay supported. This should be especially true in the US, while in Europe this process may take longer or be less prevalent (figure 11). However, we also think the Treasury market may be overstating inflation risks. The breakeven inflation curve has inverted between 10 and five years (and even two years). This could mean that the market looks at any rise in core inflation during the upcoming economic upswing as a cyclical trend which, structurally, may not endure (figure 12). Put differently, 2020 may have marked the trough in inflation (and yields) over the medium-term horizon, but not necessarily over the longer-term one.
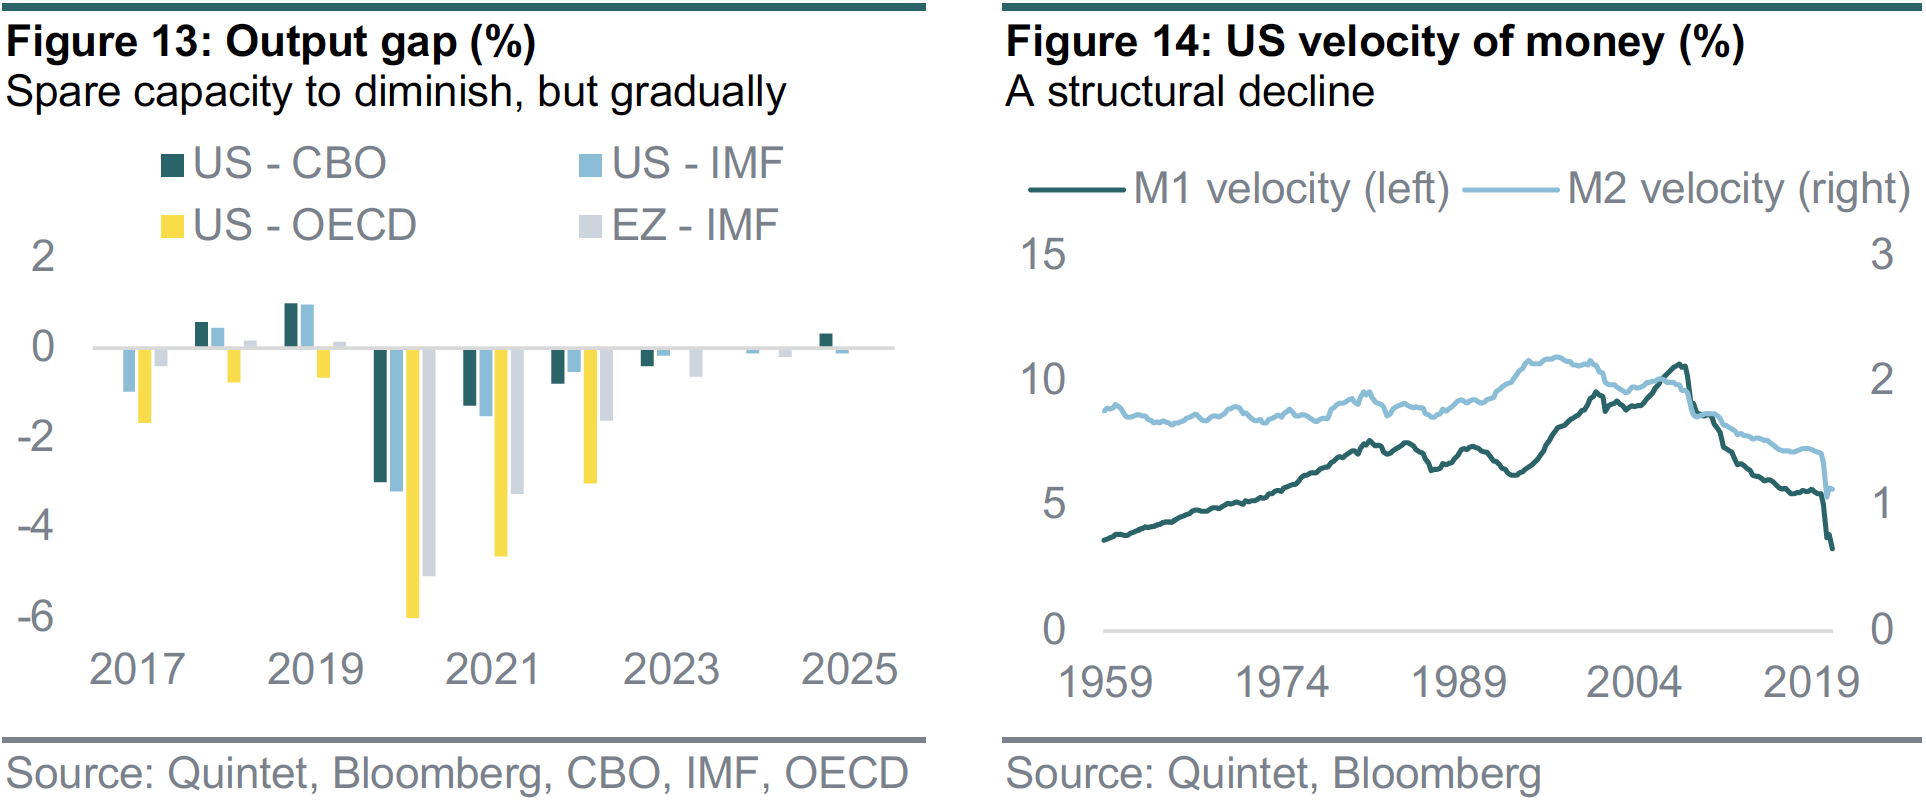
Whether inflation picks up more decisively over the longer term is an open question. Our forecast suggests that, if we’re right that we’re at the start of a new cycle, inflationary pressures are likely to increase over time – as economic slack diminishes. But how much spare capacity there really is looks unclear. The so-called output gap (which measures the discrepancy between actual and potential output) is inherently an estimate, as potential output cannot be observed. Different measures point to different degrees of slack, but all indicate substantial resource underutilisation – not for long in the US, but for much longer in Europe (figure 13). Just like with unemployment, logic would suggest a degree of ‘hidden’ spare capacity. What’s more, we’re not sure that the strong acceleration in money supply growth will lead to higher inflation. This is because the velocity of money – the frequency at which money changes hands – has been on a structural decline for more than a decade (figure 14).
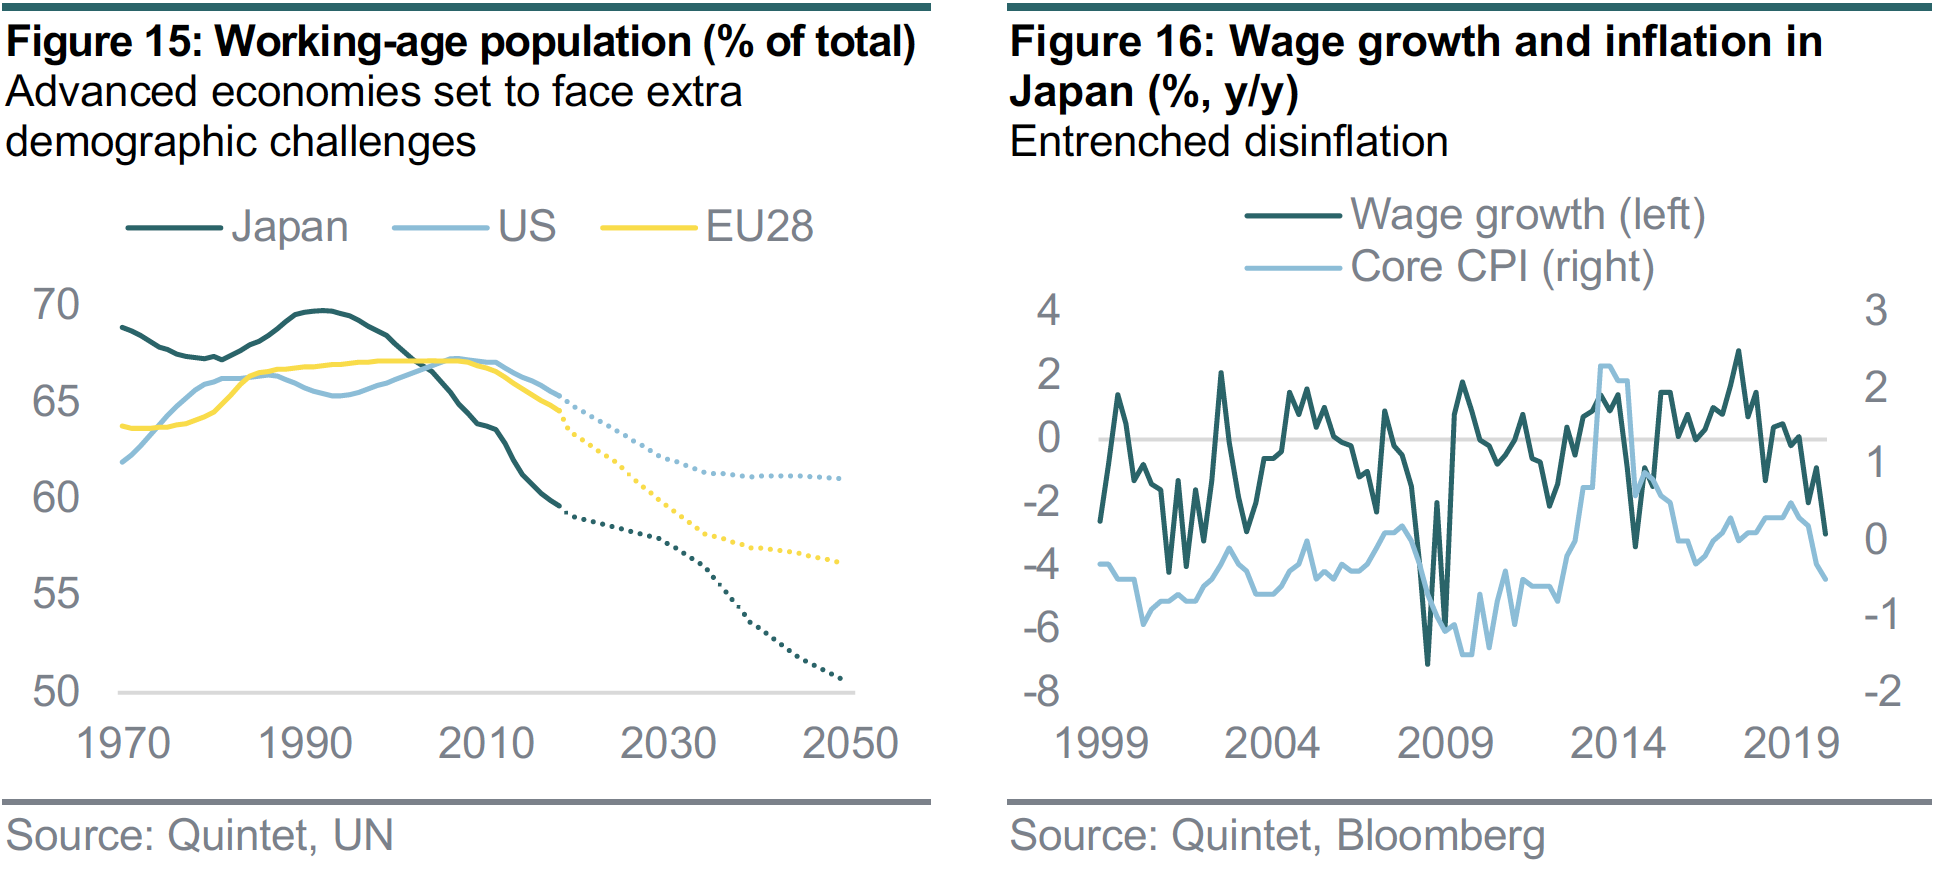
Another challenge is demographic change. The working-age population is projected to decline across the developed world (figure 15). Even though one could come up with scenarios whereby labour scarcity drives up wage growth, empirical evidence – admittedly, limited to Japan – doesn’t support this. On the contrary, it suggests that pay has stayed rather stagnant (figure 16). What’s more, even if wages did rise, it’s not clear to us that ageing societies, which tend to rely on fixed income savings, would prefer high inflation. Rather, they typically tend to prefer stable, low-inflation environments. And older cohorts of the population tend to vote to a greater extent than younger ones, affecting legislation that could potentially entrench a disinflationary bias. Of course, these dynamics may simply be specific to the Japanese economy, while the US could be different and Europe somewhere in between. However, we think it’s reasonable to at least give these scenarios some consideration.
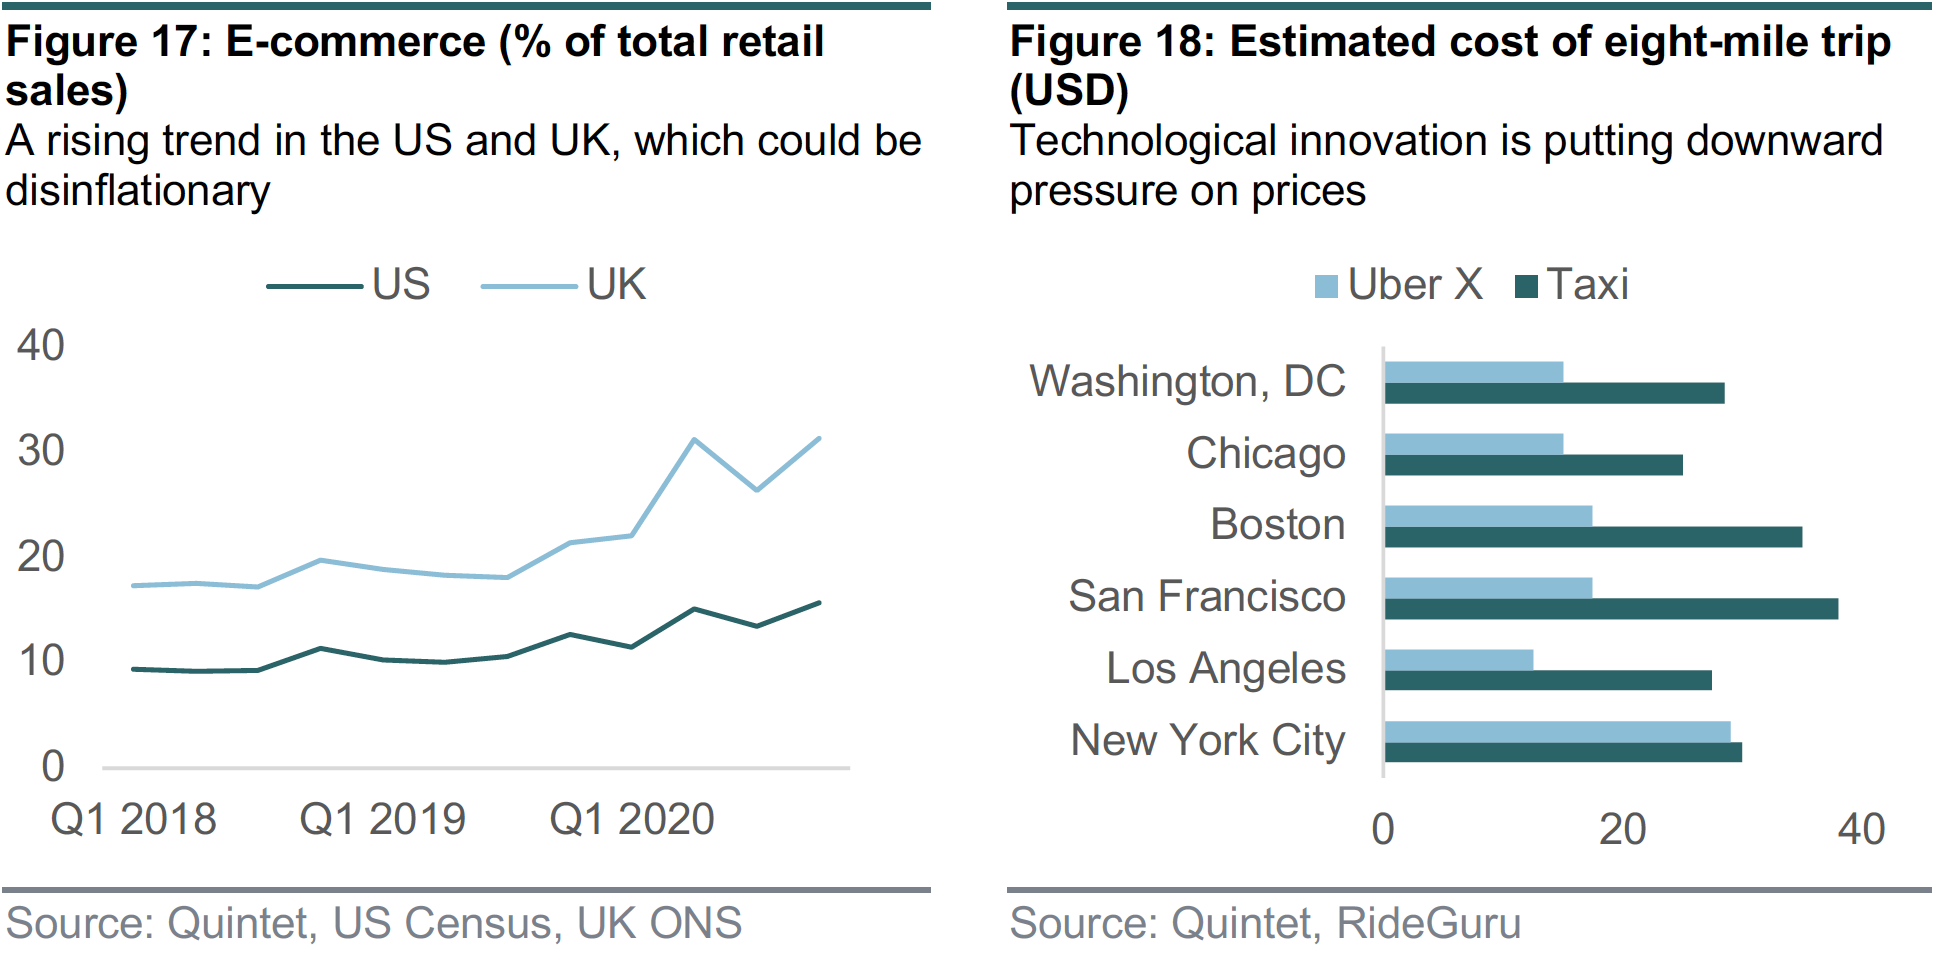
Our bias is disinflationary over longer horizons. This is because we believe that technological innovation and automation should lead to strong growth but, at the same time, keep a lid on inflation. We believe an environment like this should be positive for risk assets. Basically, our view comes down to the belief that the so-called ‘Amazon/Google/Uber effect’ is likely disinflationary. While these company names are just examples of broader trends and the overall rise of ecommerce, the ‘Amazon effect’ pushes down prices – or, at the very least, slows any price rise – by allowing consumers to bypass more expensive intermediaries (figure 17). The ‘Google effect’ may erode companies’ pricing power by reducing search costs. The ‘Uber effect’ could bring existing assets into the marketplace, further eroding established firms’ pricing power (figure 18). While these downward pressures don’t eliminate the inflation cycle, taken together they could become a key disinflationary impulse.
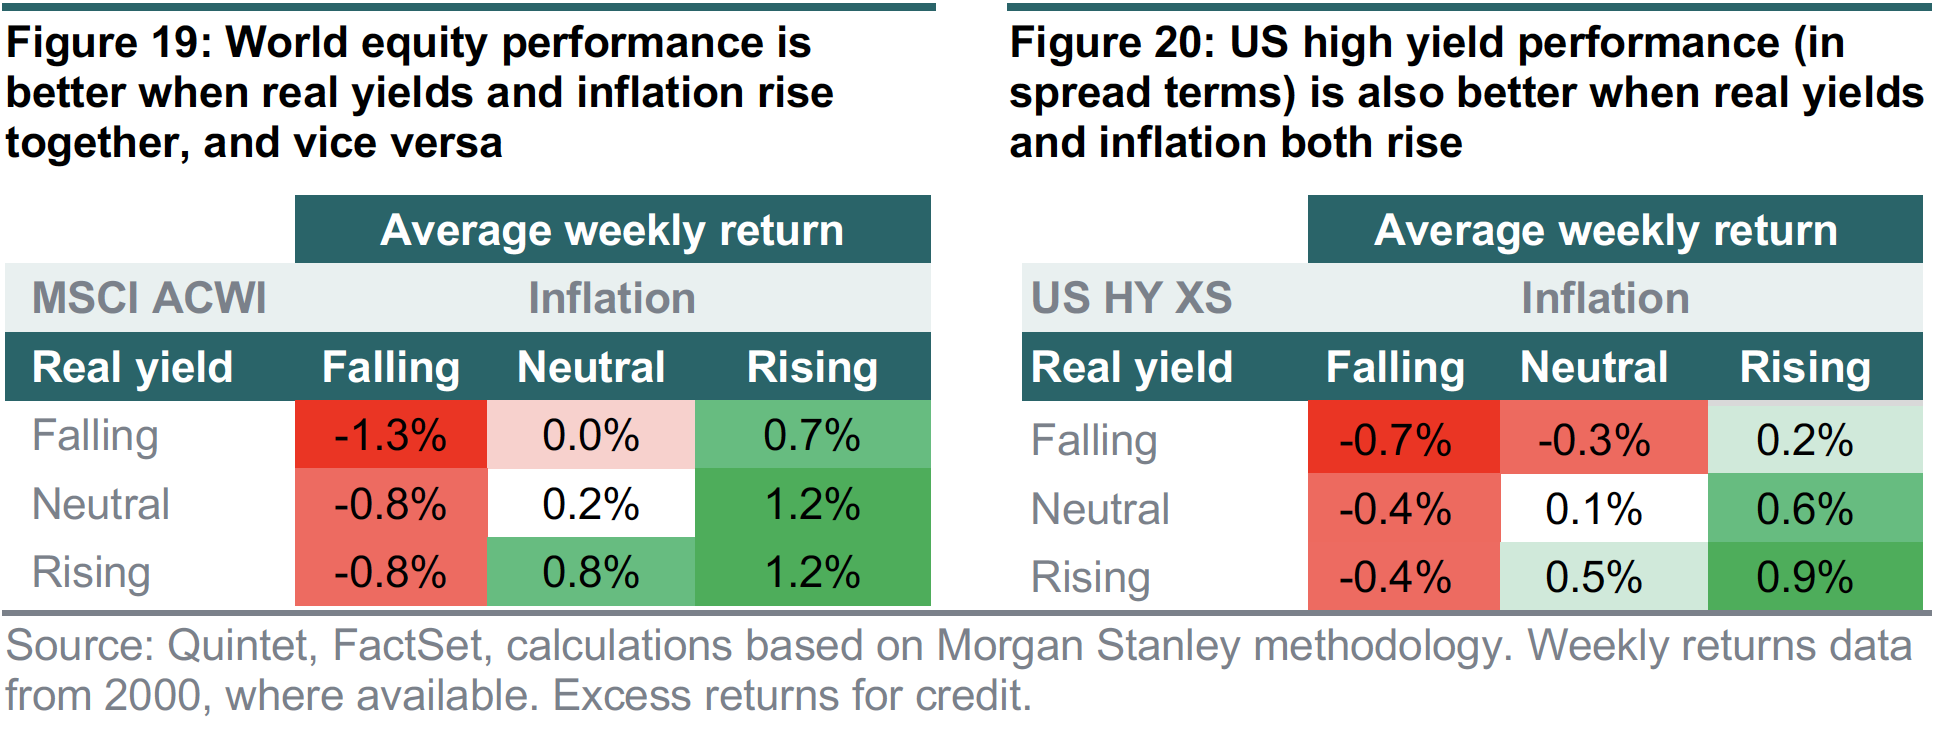
To be clear, it’s not impossible that overstimulation manages to turbocharge demand and deanchor inflation expectations, and that supply bottlenecks turn out to be more structural in nature. More realistically, though, we think the upcoming inflation spike will likely be followed by positive, but moderate inflation trends – at least until the labour market tightens more visibly and/or pipeline price pressures rise to a greater extent. We won’t likely get back to the very low-inflation, very lowyield environment seen during the pandemic. However, we won’t be in a strongly inflationary environment either. While we do forecast rising inflation and bond yields over the medium term, we see this happening in the context of stronger growth. Historical equity and credit performance has been better when rates are rising rather than falling, especially when rates are rising along with inflation expectations.
The picture we’re painting here is one where growth recovers strongly, inflation picks up but more moderately in this early phase of the cycle than historically (apart from a near-term spike), and the major central banks don’t hike rates for the next two or three years. Market pricing of nearly three Fed rate hikes through 2023 seems too hawkish to us. We expect one. In essence, this means:
Rising but historically low US yields. We now expect US 10-year yields to range between 1.75% and 2% in the fourth quarter of 2021 – perhaps ending higher than that in the final part of the quarter – and rising gradually as the cycle progresses. Eventually, central bank tightening should become a more realistic scenario. We think the Fed won’t push back if inflation overshoots slightly (since it changed to flexible average inflation targeting last year) and yields pick up mainly because of faster growth, but we think the Fed would want to continue to keep government funding costs affordable. We expect an announcement on tapering (scaling back the size/pace of asset purchases) at the end of this year, to start in early 2022. We don’t see any rate hike until 2023.
Steeper yield curves. Front-end rates should remain anchored and long-end rates increase further, but not that rapidly. That said, we don’t believe that, even when we’re through the temporary rise in inflation that we envisage from next month (March data and, more strongly, in Q2), we’ll return to inflation rates and bond yields as low as those seen during most of the pandemic. We see steeper curves as signs of normalisation but, just like with the level of yields, there’s probably a limit to how much and how rapidly they can steepen. However, should the yield rise be too fast – say, higher than between 2% and 2.5% at year-end – we’d expect the Fed to skew its purchases towards the long end of the curve, in an attempt to push yields down.
European inflation/yield outlook more subdued. There’s more scope for inflation/yield normalisation in the US than Europe, as growth prospects, vaccine trends and fiscal policy all look more favourable in the former than the latter. The European Central Bank has recently announced that it would step up the pace of bond purchases to mitigate any unwarranted rate rise. It should revisit its inflation aim from “below, but close to, 2% over the medium term” to symmetric around 2%, similar to what the Fed did last year. This means that it will let inflation rise (a high-class problem for now) above target for some time before it begins hiking rates.
Stronger US dollar. We no longer expect the US dollar to weaken to 1.25 versus the euro. We now see the current level of around 1.20 as a likely turning point and project gradual dollar strength from here. Our new target is 1.17 at year-end and 1.15 at the end of 2022. This is because we now see stronger growth and higher inflation in the US relative to the euro area, and more scope for rising Treasury yields versus Bund yields. In turn, this is because of extra fiscal stimulus in the US and faster vaccine rollouts, versus a slow implementation of the EU recovery fund and a lagging inoculation programme in the euro area.
Higher oil prices for a while longer. We also see higher oil prices than previously, ending the year at USD 75 per barrel, but with only modest upside from there. As economies open up and mobility restrictions are lifted, there’s potential for oil demand to grow to well over 1 million barrels per day month-on-month for several months in a row over the summer period. Additionally, with OPEC+ continuing to target a tight market, supply restrictions may put some pressure on prices. That said, our macro outlook wouldn’t be consistent with much higher prices at short horizons, say, above USD 80 per barrel.
Some emerging markets to struggle. The pace of increase in US 10-year yields is two to three times the ‘pain threshold’ of 20 to 30 bps per month beyond which emerging market (EM) assets typically struggle. Comparing EMs across many dimensions, our scorecards suggest that Asia has the strongest fundamentals – but it’s also the EM region where equity valuations look more challenging, although this may partly reflect structural shifts towards higher growth sectors – while Latin America shows a range of vulnerabilities. Exporters of commodities, at this stage, benefit from rising commodity prices.
Cyclicality to stay well supported. When the cycle turns from recession to pickup, and eventually expansion – when things move from weak and getting weaker to weak and getting better, and eventually strong – what tends to happen is that assets geared to accelerating growth outperform, including cyclical stocks, sectors and investment styles. Core rates typically underperform. Long-duration, growth stocks such as tech may be impacted by a somewhat higher discount factor – and, briefly, they have been – though this is just one factor to consider and the horizon that matters here is a longer one.
Authors:
Daniele Antonucci Chief Economist & Macro Strategist
Tom Kremer Senior Fund Manager
Bill Street Group Chief Investment Officer
This document has been prepared by Quintet Private Bank (Europe) S.A. The statements and views expressed in this document – based upon information from sources believed to be reliable – are those of Quintet Private Bank (Europe) S.A. as of 22 March 2021, and are subject to change. This document is of a general nature and does not constitute legal, accounting, tax or investment advice. All investors should keep in mind that past performance is no indication of future performance, and that the value of investments may go up or down. Changes in exchange rates may also cause the value of underlying investments to go up or down.
Copyright © Quintet Private Bank (Europe) S.A. 2021. All rights reserved.