


WHAT YOU NEED TO KNOW
- Rising US-China tensions are a downside risk to the macro and market outlook, but political and economic considerations point to a “cold” trade war prior to the US election
- The cycle is improving from here. We expect China to pick up momentum, along with the rest of the emerging market (EM) complex, excluding Latin America. The US should follow, and then Europe
- Rising trade tensions are a key risk to this investment call but, to derail it, they will have to escalate meaningfully
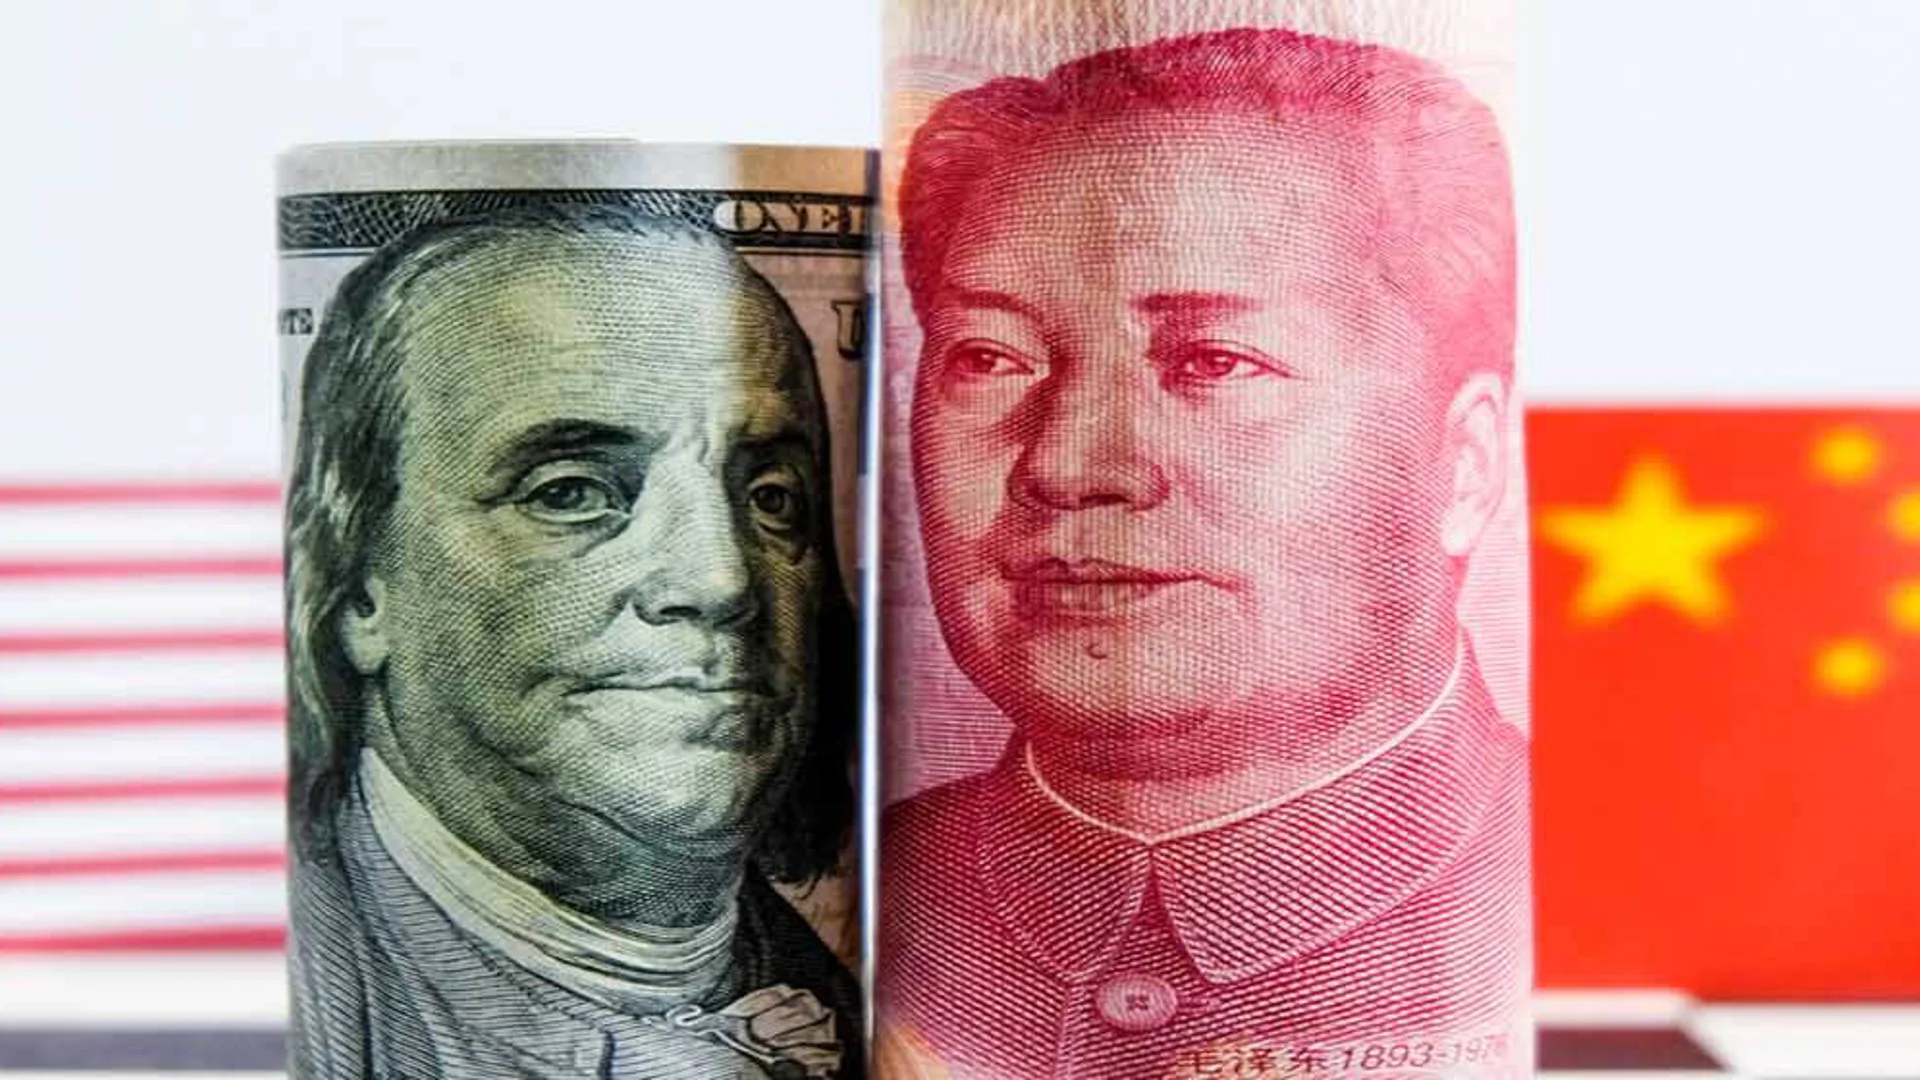
NOT COOLING DOWN BUT NOT HEATING UP EITHER
Tensions between the US and China have risen lately, with several key issues beyond trade emerging as sticking points. The fact that China has, so far, been unable to increase imports from the US at the required pace to meet the phase 1 trade deal terms is not helping – though this is mostly due to the sharp shortfall in economic activity earlier this year. However, the US also appears dissatisfied with how China dealt with the initial stages of the Covid-19 virus outbreak.
Furthermore, following a recent assessment by its State Department, the US has outlined potential measures that would affect Hong Kong’s special treatment, ranging from the export control framework, to the extradition treaty, and an eventual convergence to mainland China tariff levels. The US also mentioned a range of non-tariff measures that could potentially be applied to China, such as visa restrictions and sanctions on individuals, and that a working group would study the differing practices of Chinese companies listed on US financial markets.
While this may seem a repeat of the 2018 trade war, what is different this time around is both the economic environment (much weaker, but starting to improve) and the political situation (we are in a US election year).
The interplay between these two drivers suggests that a de-escalation will not be easy to engineer as the November vote approaches. However, it also suggests that neither the US nor the Chinese economy can withstand further shocks, such as a meaningful escalation, as they are just moving off their lows and entering a phase of repair.
For the US, voters believe that economic recovery should be one of the top priorities, according to the polls. This is why, perhaps, no official statement has been made with respect to the US-China trade deal. Neither have we seen any mention of US tariffs on mainland Chinese exports, nor talks of sanctions on Hong Kong’s financial sector.
So, while these more substantial measures remain a downside risk to our base case of a U-shaped economic recovery, so far what is happening does not look like the trade escalation that almost put the global economy in recession last time around. Rather, this appears to be a series of changes to select rules affecting specific aspects of the US-China relationship.
EMERGING MARKETS RECOVERING AT VARYING SPEEDS
Looking at the major economies around the world, China was the first to impose a stringent lockdown. And also the first to lift it. The purchasing managers’ indices have bounced back, pointing to improving activity, especially in the services sector. Chinese data are now rarely surprising to the downside and leading indicators are improving too. Our view is that the Chinese economy – a key driver of the global cycle – is on track to accelerate once again, although it will take a long time to make up for the lost output. We would expect this acceleration to continue, gradually, throughout the second half of this year, provided that our base case of no major escalation in trade tensions materialises.
The Google Mobility database suggests that the Asian economies most dependent on trade with China, such as South Korea, Thailand and Malaysia, show some sign of stabilisation too – though not yet everywhere. Latin America is now a major coronavirus hotspot, and debt sustainability is an issue in some countries. Parts of the Central and Eastern Europe, Middle East and Africa (CEMEA) region look past the worst of the lockdown- driven collapse in output, as restrictions on movement and economic activity begin to ease. However, their relatively high exposure to Western Europe, which is recovering more gradually than China, means that they are improving somewhat slowly.
GLOBAL CYCLE PAST THE BOTTOM
Our base case is that, prior to the US election, tensions are unlikely to de-escalate, but they will probably not escalate significantly either. Risks of more meaningful frictions on trade and other areas at some point, however, do remain – both in the short term and, perhaps more so, over the longer term.
With this balance of risks in mind, we think that the global economy – as the reopening process continues – should stage a substantial rebound in growth over the next couple of months. We would expect the headline macro indicators to pick up markedly from depressed levels as we move into the third quarter – not just in China, but also in the US (as the latest payroll numbers show) and, more moderately, in Europe.
Just as the dataflow undershot expectations on the way down, we think that it is likely that it will overshoot expectations on the way up. We note that downside surprises are already becoming less widespread. This should provide a further tailwind to the most growth- sensitive assets over the short term, allowing recent trends to extend.
Should our bear case of a more meaningful escalation play out, we would envisage a potentially significant economic downturn. The big picture is that the first-round effects would imply weaker China growth and lower commodity prices. This would also bring back a stronger bid for USD and other safe-haven currencies, and a weaker CNY. We would expect more unconventional stimulus, and thus lower interest rates globally. Second- round effects would include weaker global growth, as economies exposed to China were eventually impacted, ranging from the rest of Asia to European exporters such as Germany and parts of Latin America. Third-round effects would impact the local supply chains of these countries.
ASSET ALLOCATION IMPLICATIONS
Our current tactical asset allocation (TAA) is exposed to the US-China trade tensions primarily via the overweight to EM, namely: overweight EM equities, and overweight in EM sovereign hard currency bonds. In our base case scenario of no significant escalation, both overweight positions should continue to benefit from:
- a continued improvement in macro dynamics (the economic repair phase);
- a supportive market environment (improving investor risk appetite, easier financial conditions);
- reasonable equity and attractive sovereign debt valuations (EM equities’ three-year forward price- earnings ratio is 9.9 times; close to the historical mean; EM sovereign hard currency bonds offer a credit spread of 480 bps, over two standard deviations wider than the historical mean).
EM equities are arguably more sensitive than EM sovereign hard currency bonds to any escalation of trade tensions, given their large exposure to China and Asian markets (40% and 79% of the market index, respectively), and relatively high historical volatility (19% p.a.).
It is worth noting, however, that our preference for EM equities is in the context of a broader TAA vector, which includes overweights in portfolio diversifiers and an underweight in European equities. Therefore our sensitivity to trade tensions in the TAA is actually materially mitigated by non-EM positions. EM Sovereign Hard Currency bonds, on the other hand, have a much lower exposure to Asian countries (19% of the market), and lower historical volatility (10%).
The combination of relatively high yield to maturity, historically-wide credit spreads and broad regional diversification renders this asset class robust to broad market volatility.
Authors:
Bill Street Group - Chief Investment Officer
Daniele Antonucci
Carolina Moura-Alves
James Purcell
COVID-19 WATCH
Globally confirmed cases of Covid-19 exceeded 6.8 million, up from approximately 6million seven days previously. In Brazil, the health ministry removed historic Covid-19 data from its website amid mounting cases and international criticism. The quality of future Brazilian Covid-19 data has been questioned, as undefined measures to “improve the reporting of cases” were announced.
We consider Covid-19 developments as a potential risk to our positive view on EM financial assets. Taking the seven-daily rolling average of daily new cases and normalizing for population we can observe a number of distinct geographic waves. Asia, relative to population, did not experience a significant Covid-19 wave, Italy’s daily case count peaked in late March and the US peaked in mid-April. As widely discussed, Brazil and Latin America are the current epicentre of the Covid-19 epidemic, while case counts in other parts of the EM complex – such as in the Indian subcontinent and sub-Saharan Africa – are showing upward trajectories.
The graph clearly illustrates that, relative to population size, China quickly confined the spread of Covid-19 even before confirmed cases reached 100 persons for every million inhabitants. South Korea took a little longer to deal effectively with Covid-19, with daily confirmed cases rapidly declining once 200 persons for every million inhabitants were infected. Italy struggled to control the pandemic, with 4,000 confirmed cases for every million inhabitants. However, Italy now appears to have regained control. The US is just beginning to “bend the curve”, but population-adjusted confirmed cases are already at a higher level than Italy’s, while Brazil already has 2,000 confirmed cases for every million inhabitants, and the pace of new daily confirmed cases show no signs of slowing. As investors, this analysis gives us significant insight into the efficacy of each country’s social distancing and containment measures. It provides an indication of how effective each country’s policies may be, should a “second wave” emerge. The ability to quickly respond to, and contain, a future pandemic will have significant economic and financial market consequences and, for risk assets, will produce significant regional “winners” and “losers”.
This document has been prepared by Quintet Private Bank (Europe) S.A. The statements and views expressed in this document – based upon information from sources believed to be reliable – are those of Quintet Private Bank (Europe) S.A. as of June 8, 2020, and are subject to change. This document is of a general nature and does not constitute legal, accounting, tax or investment advice. All investors should keep in mind that past performance is no indication of future performance, and that the value of investments may go up or down. Changes in exchange rates may also cause the value of underlying investments to go up or down. Copyright © Quintet Private Bank (Europe) S.A. 2020. All rights reserved.