


At the beginning of the new year, we look back at the performance of our Quintet Group Strategic Asset Allocations (SAA). In this second edition of our biannual review we explore how our SAAs fared amid buoyant risk markets and macro volatility.
- Our group SAAs are the most efficient risk-adjusted portfolios for a range of risk appetites. They are optimised over the long term on an index level. Returns across risk profiles were higher in 2021 than in an average year and volatility was lower.
- Most equity markets enjoyed double-digit returns, while safer bonds faced more challenges. Riskier bonds did well in general though emerging market debt struggled with rising price pressures and tightening central banks. Chinese equities suffered from local headwinds. These dynamics are reflected in the performance of our SAAs.
- For euro investors, our SAA with 45% in equities returned almost 11% with a realised volatility of less than half of that. For portfolios based in sterling, our SAA with 45% in equities returned 8% with a volatility of 5.4%.
Our Quintet Strategic Asset Allocations (SAA) are an important part of the process for growing and protecting our clients’ wealth. When devising these optimal core allocations – carefully and rigorously – we take a long-term view. We review their performance regularly, meticulously and conscientiously. At the start of the new year, we do so by looking back at how they fared in an extraordinary and eventful market environment.
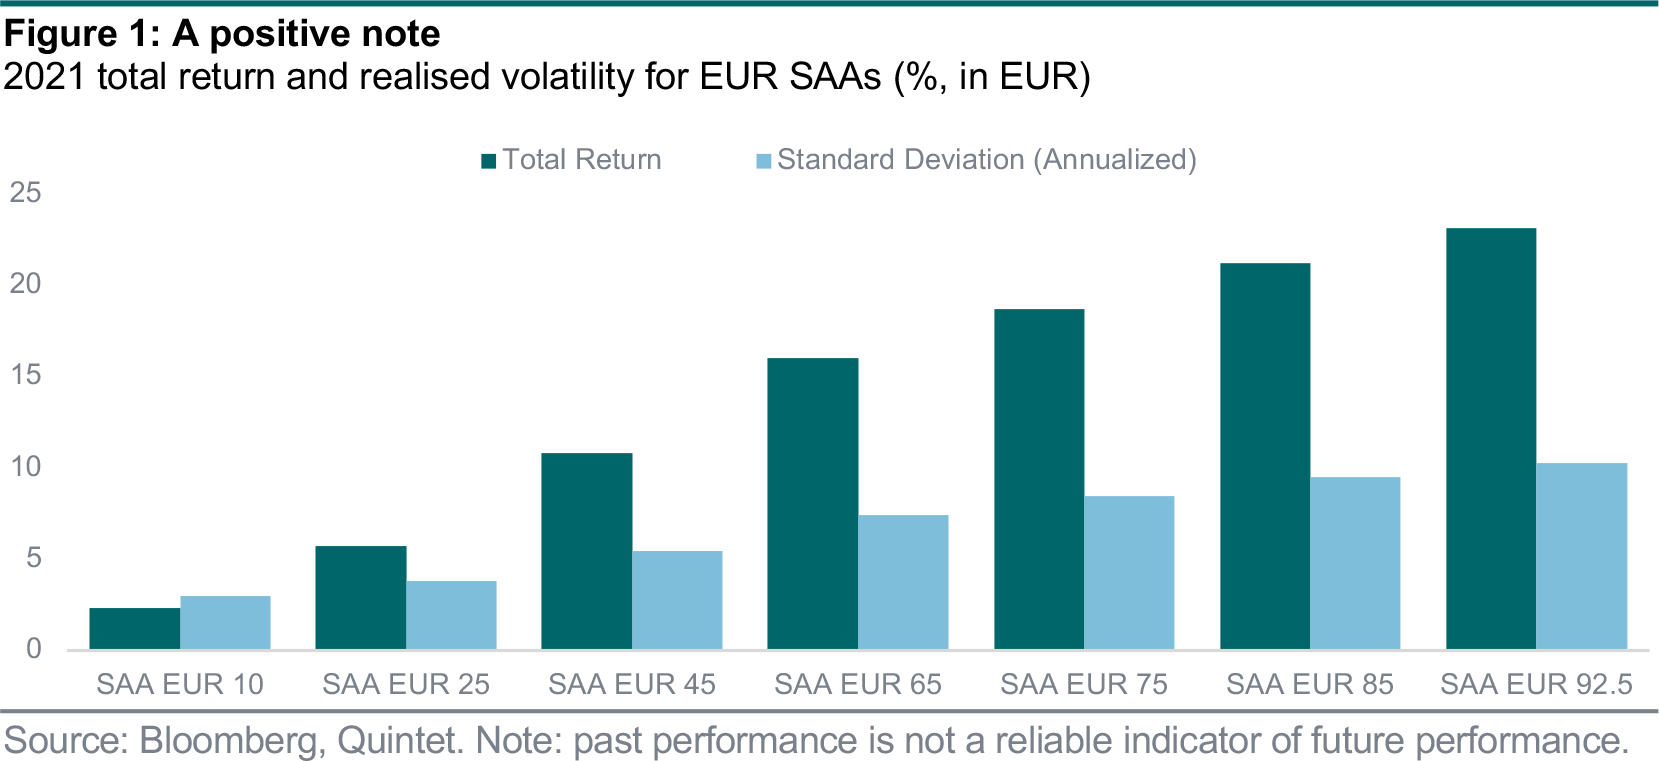
Risk assets, in particular equities, enjoyed strong performance last year, while higher-rated bonds endured a more challenging period. That is reflected in the performance of our SAAs. A risk profile with 45% of the portfolio allocated to equities returned 10.8% in EUR terms (before TAA, implementation, sustainability alpha and fees) with a realised volatility of just about half of the return. The risk profile with 65% in equities resulted in a total return of 16% and a realised volatility of just 7.4% (figure 1).
With the euro depreciating 4% on a trade-weighted basis, the currency has been a positive for the return of our EUR SAAs. Our SAAs in other base currencies have also enjoyed decent returns with low risk. For instance, our risk profile in GBP with a 65% weight in equities returned 12.3% with 7% volatility and the same USD allocation resulted in a return of 12.5% with a volatility of 7.3% in local currency respectively.
Last year was an extraordinary one for financial markets. In our SAA review at the halfway point (Counterpoint weekly: With the benefit of hindsight, 5 – 11 July 2021) we noted that the first half of the year was characterised by strong equity market returns, which continued over the second half. Most regional equity markets in scope for our SAA delivered double-digit returns (in EUR) with untypically low swings up and down along the way. US Treasury Inflation-Protected Securities (TIPS) also had a good run amid increasing price pressures in the global economy. Other bond markets experienced more challenges last year. These trends are reflected in our SAAs.
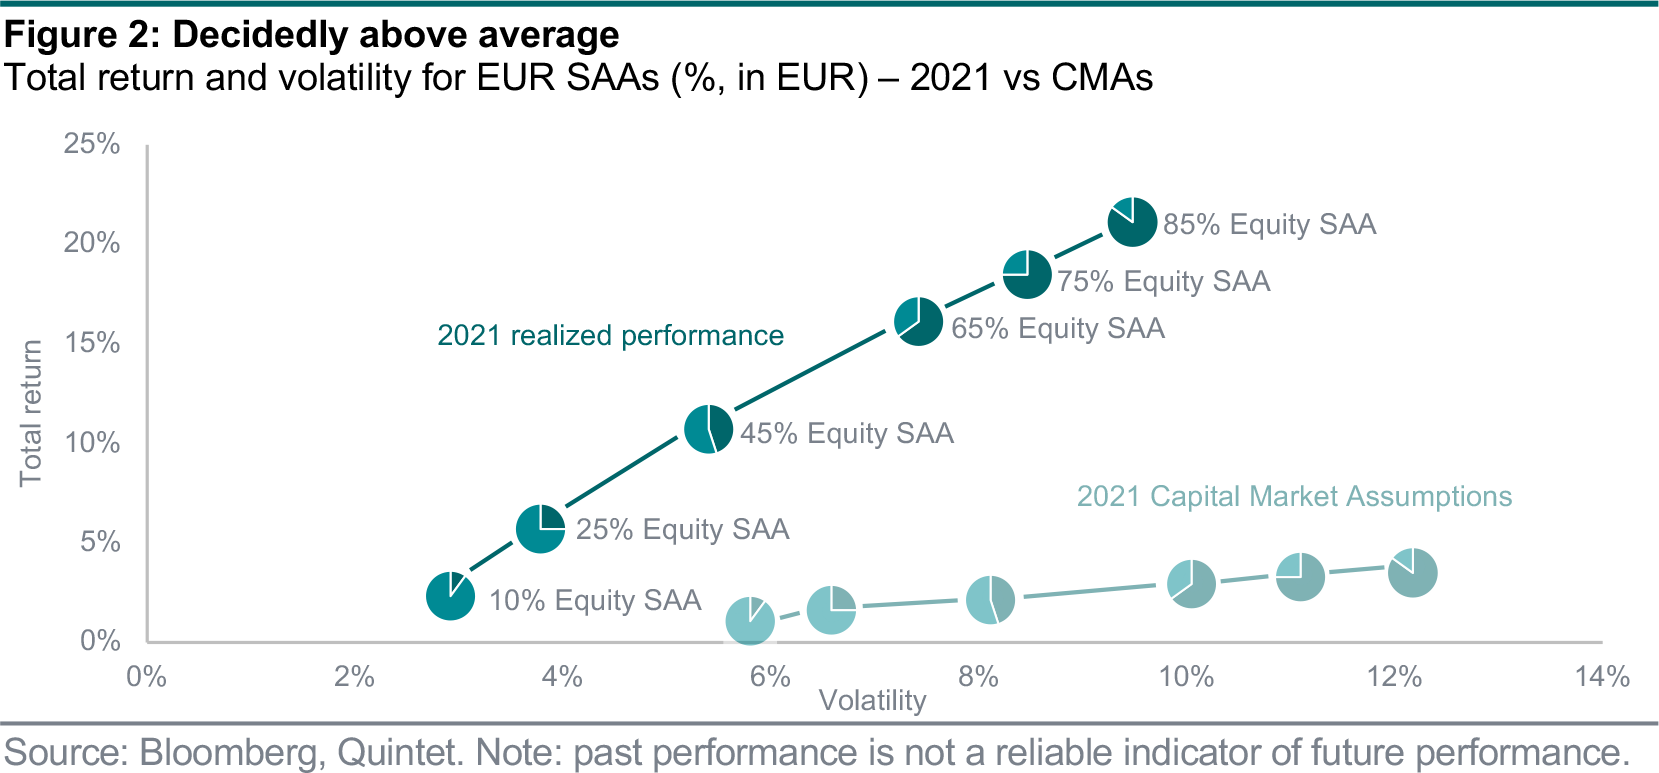
Across our different risk profiles, returns in our EUR SAAs ranged from 2.3% for our most fixed income-heavy portfolio to 23.1% for the most equity-heavy one (figure 2). Our EUR SAA risk profile with 45% of the allocation in equities, which we often refer to as balanced, returned almost 11% in EUR terms (before TAA, implementation, sustainability alpha and fees) with a realised volatility of just about half of its return. Those are impressive numbers when we put them in context.
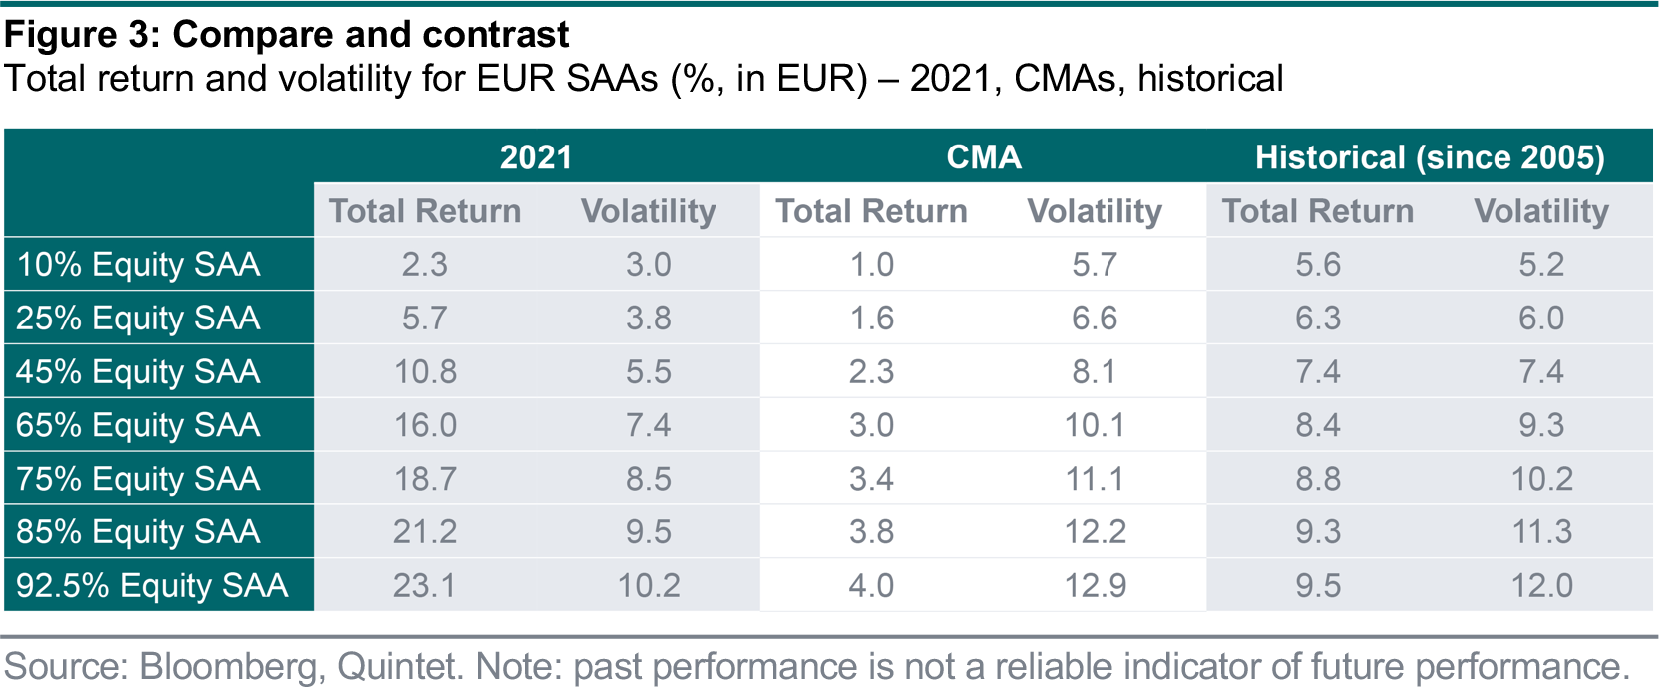
In our capital market assumptions (CMAs), which build the foundation of our SAAs, we expect a return and volatility of 2.3% and 8.1% respectively in an average year over the next decade for our EUR 45% equity SAA. That’s 3.5 times lower than the return realised last year, when realised volatility was much lower than we should prudently have expected. Historically, this risk profile has delivered a 7.4% annual return and a 7.4% volatility on average. An extraordinary year indeed.
This ‘outperformance’ relative to what we should reasonably expect in any given year was significant and mirrored in all our EUR SAA risk profiles across both return and risk (figure 3 on page 3). The same applies, in direction if not in magnitude, when we compare our various SAA risk profiles with their own history since the start of 2005 – but only for the profiles with a more substantial share in equities. The returns from more fixed income-heavy portfolios reflect the challenges higher-rated bonds faced last year, even if the bond market remained surprisingly calm in historical terms. Of course, these comparisons also serve as a reality check. We should not extrapolate last year’s risk-adjusted returns blindly. In many way it was an extraordinary period.
The headline numbers mask the finer details. Market performance has not been even throughout 2021 and neither has the performance of our SAAs (figure 4). The year started on the wrong foot with returns of our EUR 45% equity SAA down 0.35% in January, followed by flat returns in February and elevated volatility. A bumper March pulled up the whole Q1 performance and January turned out to be one of only two months with negative returns. The other month was September when performance of that SAA risk profile was -1.8%, pulling overall Q3 performance lower.
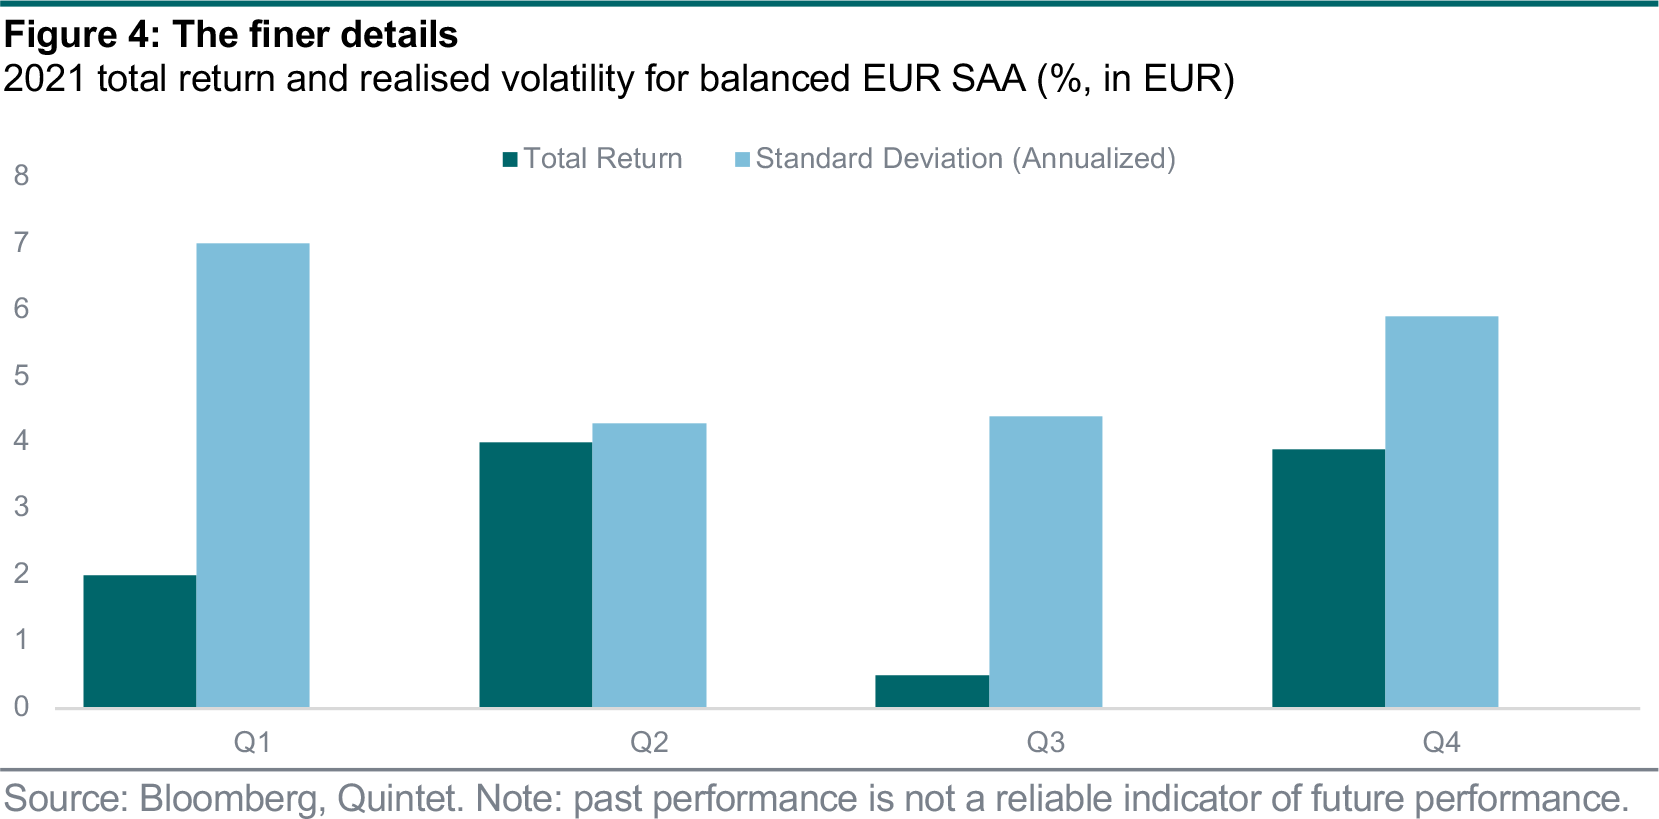
Q3 had been characterised by intensifying worries about the transitory nature of inflation accompanied by a more hawkish tone from developed market (DM) central banks. About half of the US Federal Reserve’s rate-setting committee had started to pencil in a first rate hike in 2022, rattling markets. The end of the year proved to be a more supportive return environment even as volatility, which had let up over the summer months, returned as a new Covid variant emerged.
Throughout the year the main performance driver was the equity part of portfolios. Of the 18 asset and sub-asset classes that make up our SAAs, 11 added to performance in EUR terms, while six detracted from it. Emerging market (EM) hard currency corporate bonds were exactly flat on the year (figure 5). Of the 11 positive performers, seven were equity regions. Only one equity market in scope for our SAAs was negative – Chinese equities.
It shouldn’t come as a surprise that most of the return as well as volatility in our balanced EUR 45% equity SAA came from the equity exposure. Equity risk premia tend to be higher than those for safer assets. Other risky assets, in particular high yield bonds in Europe and the US, also added to overall performance. US TIPS benefited from the strong rise in inflation last year. Meanwhile, gold’s return contribution was positive thanks only to the currency effect.
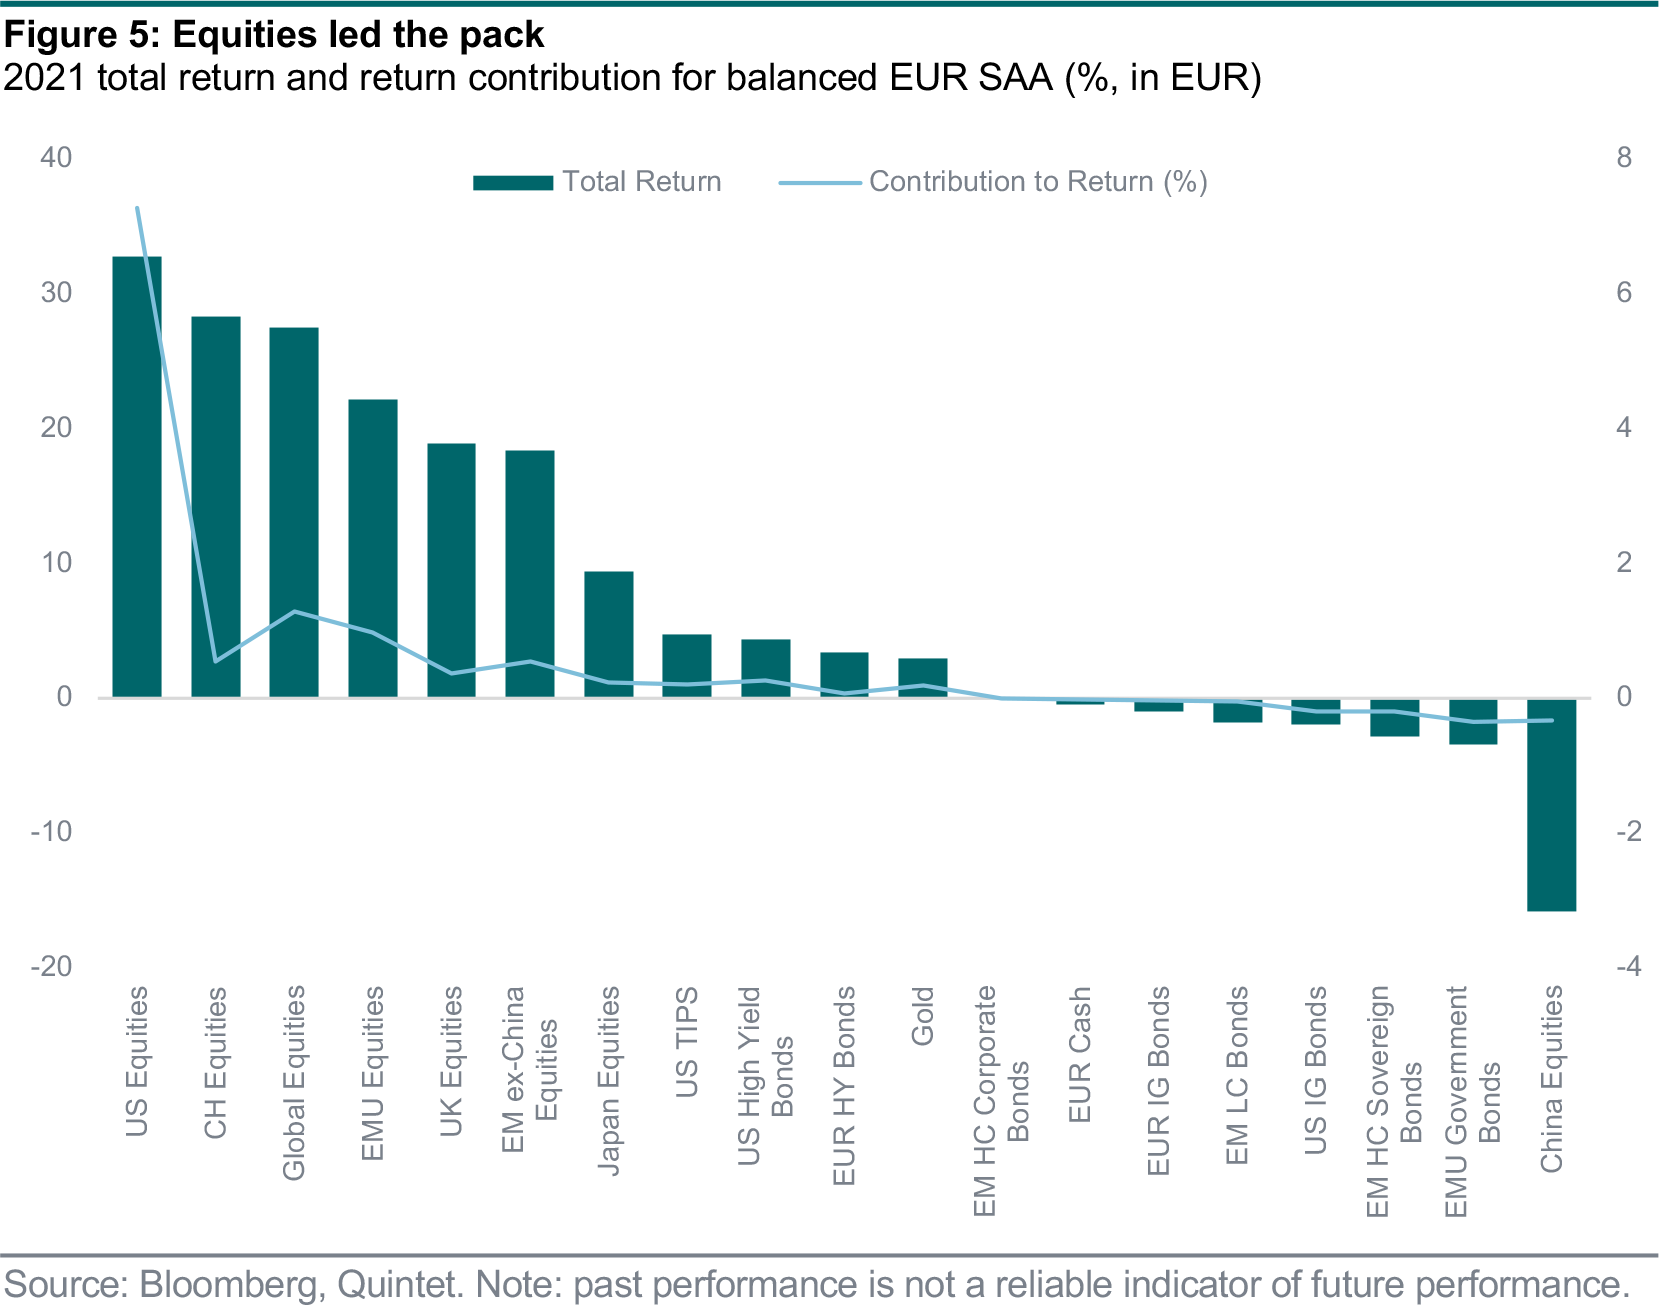
EM bonds suffered from rising rates as some EM central banks hiked rates before their DM counterparts amid rising inflation, and weakening currencies versus the US dollar amid expected tightening from the Fed. Corporate bonds fared better than sovereigns as the corporate index has both higher credit quality and lower duration.
The MSCI China total return index, which we use in our SAAs to capture our exposure to Chinese equities, declined by almost 16%, measured in EUR, last year. Most other equity markets posted double-digit returns, including a broader EM index excluding Chinese equities. Given the low absolute weight Chinese equities hold in our portfolios – in a EUR SAA with 45% equities we allocate 2% to Chinese equities, which is roughly in line with market capitalisation – the total drag on performance is limited.
Last year was no extraordinary one for the Chinese equity market, at least not from a historical perspective. Five out of the past 20 years have seen worse or comparable performance measured in EUR (figure 6 on page 5). That’s a quarter of the time since 2000, not including last year. After all, this is an asset class with a historical volatility above 20%, and we expect it to remain a volatile market.
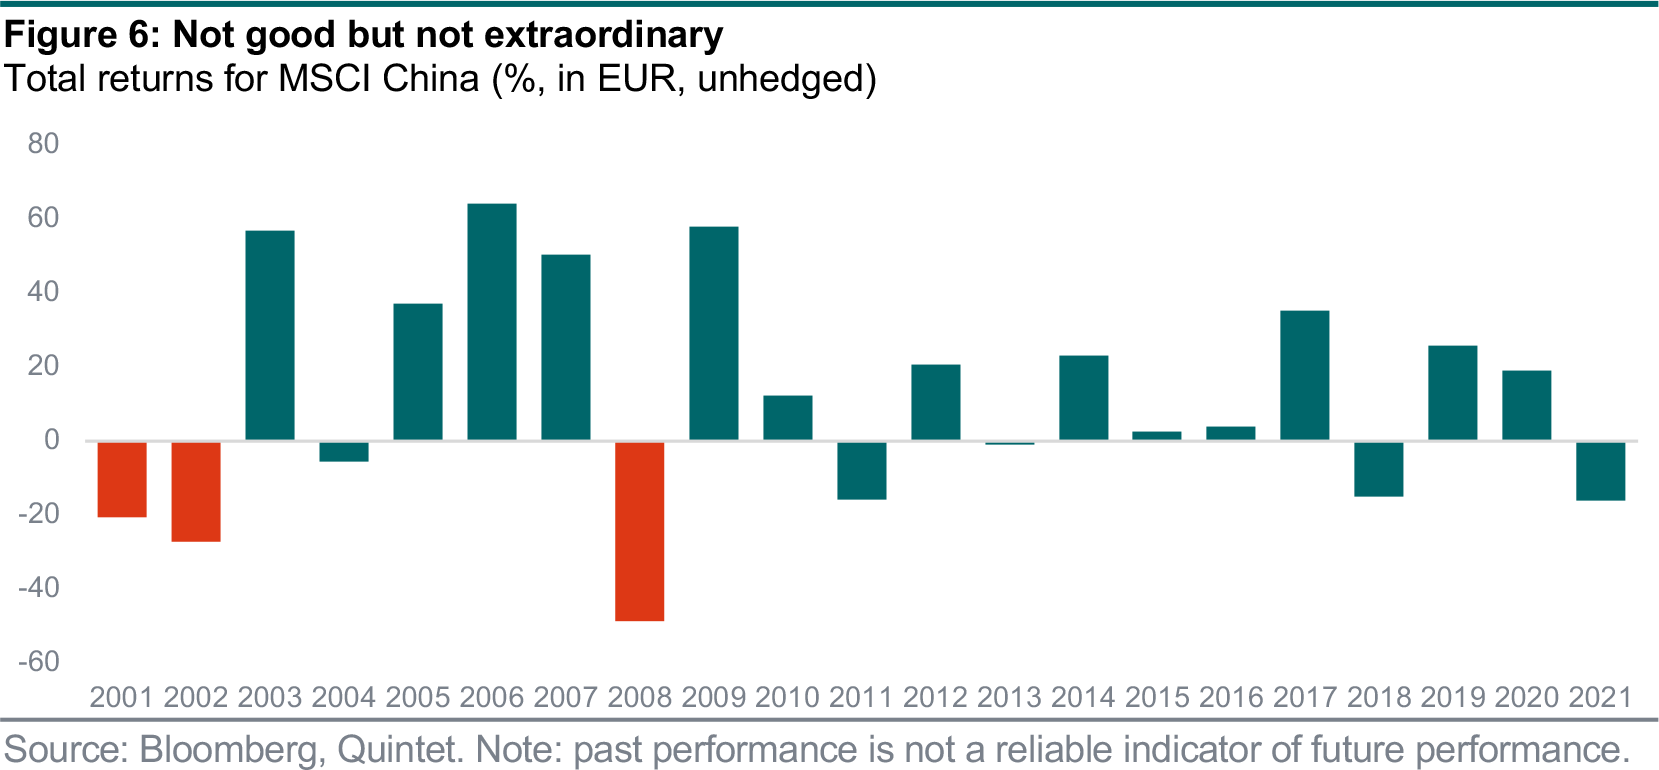
The factors weighing on Chinese equities last year were largely idiosyncratic. They include a regulatory crackdown, concerns surrounding the property market, and less stimulus from monetary and fiscal authorities than elsewhere. Such domestic risks are exactly what drives our obsession with getting diversification right for our clients.
We tend to put the spotlight on our EUR SAAs performance in euros. That warrants a note on the currency effect in play last year. It is responsible for 2.7% of the total 10.8% return of a EUR 45% equity SAA – about a quarter. The only asset class where currency detracted from performance is in Japanese equities (figure 7).
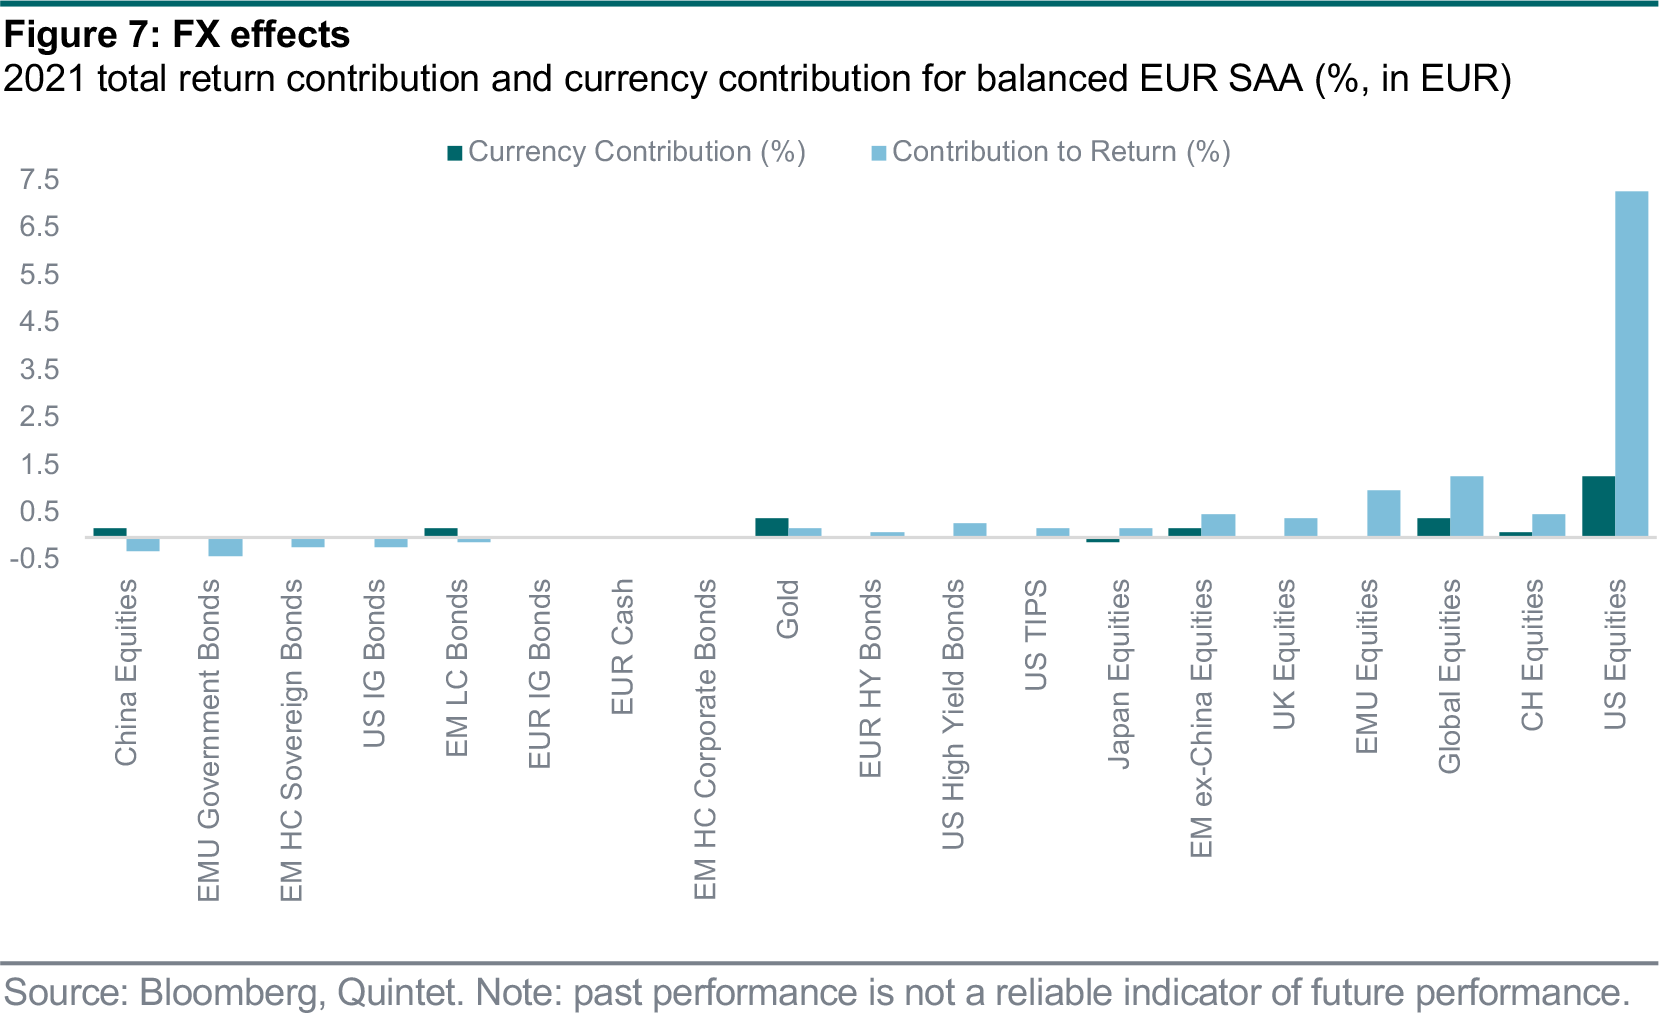
We are not surprised that the currency has been a positive factor in the total performance of our EUR SAAs given the euro depreciated by 4% on a trade-weighted basis and by 6% and 7% respectively versus sterling and the US dollar. Returns in our other base currencies have been as strong, save for the currency contribution, and volatility equally low in a historical context or compared to what one should reasonably expect in an average year.
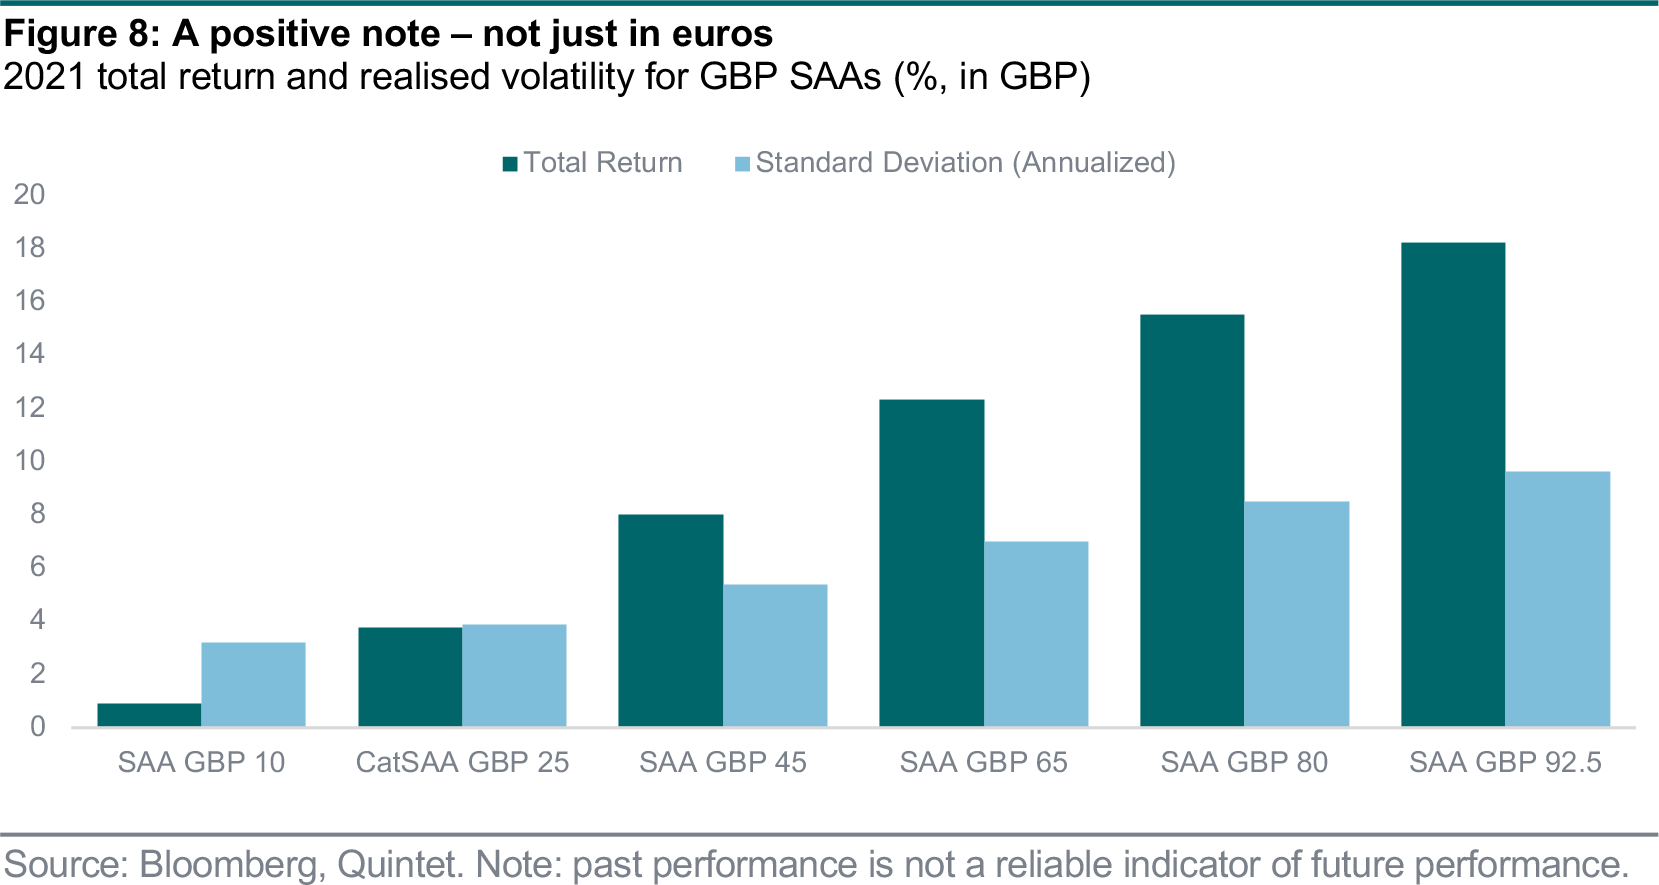
For instance, our GBP SAAs with a 45% and 65% share allocated to equities returned 8% and 12.3% respectively in sterling with a volatility of 5.4% and 7% (figure 8).
The past year was an eventful one for financial markets. Risk assets, and equities in particular, enjoyed a bumper period, while safer bonds faced a more challenging environment. Some assets and regions faced idiosyncratic shocks, most notably Chinese equities, highlighting the value of careful diversification. Euro-based clients benefited from currency depreciation.
The market’s performance is reflected in our SAAs. We do not construct our SAAs for any specific year. We have a 10-year horizon in mind when we optimize our allocations so that our clients can stay invested and benefit from rigorously designed, sustainable investments. But when we do take that look at our SAAs in the rearview mirror, we find that returns have been higher than we could expect in an average year and the journey has been smoother.
On the flip side, putting 2021 in context serves as a reminder that we shouldn’t blindly expect a repeat of that performance every year. Over the long term, it pays to stay invested in a carefully designed portfolio that takes diversification seriously.
Authors:
- Patrik Ryff Strategic Asset Allocation Strategist
- Carolina Moura-Alves Group Head of Asset Allocation
- Philipp Schöttler Cross-Asset Strategist
- Bill Street Group Chief Investment Officer
This document has been prepared by Quintet Private Bank (Europe) S.A. The statements and views expressed in this document – based upon information from sources believed to be reliable – are those of Quintet Private Bank (Europe) S.A. as of 31 January 2022, and are subject to change. This document is of a general nature and does not constitute legal, accounting, tax or investment advice. All investors should keep in mind that past performance is no indication of future performance, and that the value of investments may go up or down. Changes in exchange rates may also cause the value of underlying investments to go up or down.
Copyright © Quintet Private Bank (Europe) S.A. 2022. All rights reserved.