


In this latest note exploring our approach to strategic asset allocation (SAA), we answer some common questions. How do we arrive at our return expectations? How to deal with lower future returns when building globally diversified portfolios? What is the role of geopolitics and sustainability in our investment process?
- In our Counterpoint series on how we approach strategic asset allocation (SAA) we usually take a deep dive into a specific topic. This time, we are taking a different route by answering some of the questions we are frequently asked.
- We highlight why our approach to SAA improves risk-adjusted performance and where we deviate substantially from standard index composition. We also explore how we generate return projections.
- The right SAA profile for you is the one that matches your risk tolerance and financial goals, and we explore how we deal with the expectation of a lower return environment than in the past. We also answer questions on another pillar of our investment process: sustainability and how geopolitical factors flow into our approach for assessing ESG factors.
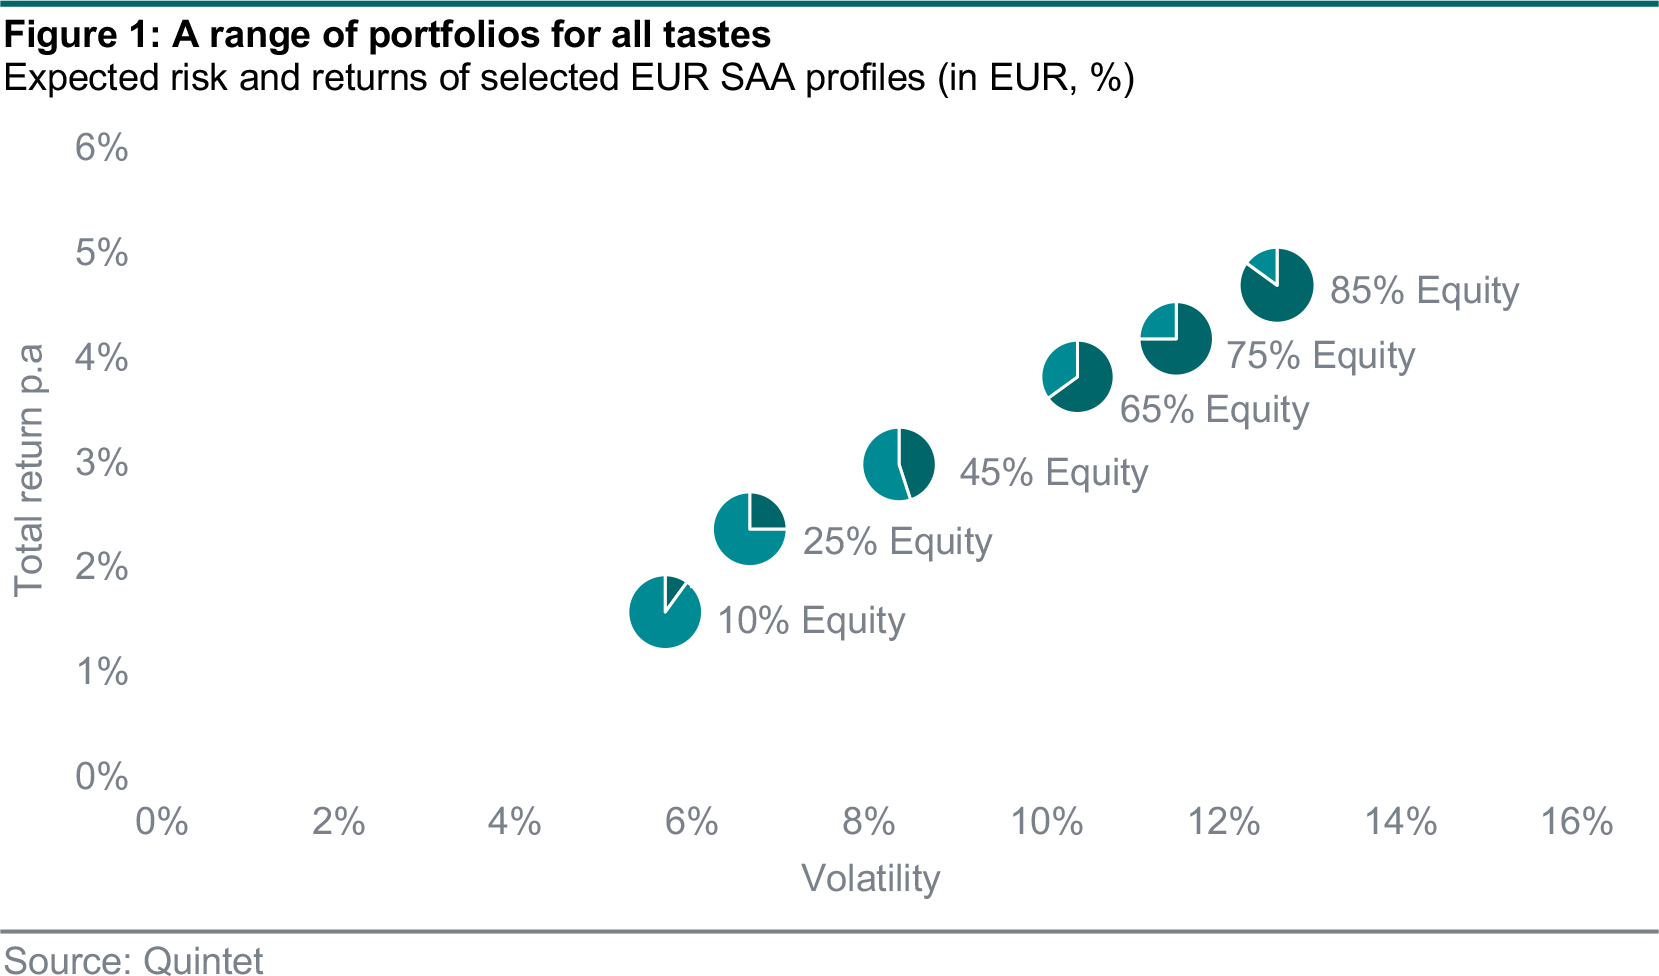
SAA forms the basis of our investment process and is a key part of any well-constructed investment portfolio. Our SAAs define a set of globally diversified portfolios that deliver long-term returns in line with individual risk appetites and return objectives (figure 1). Our goal is to produce the most efficient portfolios from a risk-adjusted perspective to help you reach your financial goals.
History shows that SAA determines most of the risk and return in a portfolio. To find the right one for you, we start by identifying which asset classes are in scope, considering liquidity, accessibility and sustainability. For each asset class in our universe, we estimate the long-term expected return and risk. Our horizon for these capital market assumptions (CMA) is 10 years.
We then identify the number of portfolios to span our clients’ risk tolerance spectrum, from low to high. For each pre-identified risk level, we determine the optimal portfolio allocation from a risk and return perspective. We use a robust optimizer to do so. Finally, we simulate both forward-looking and historical dynamics of our SAAs and check consistency with our longer-term market and macro views.
Why do we focus so much on SAA?
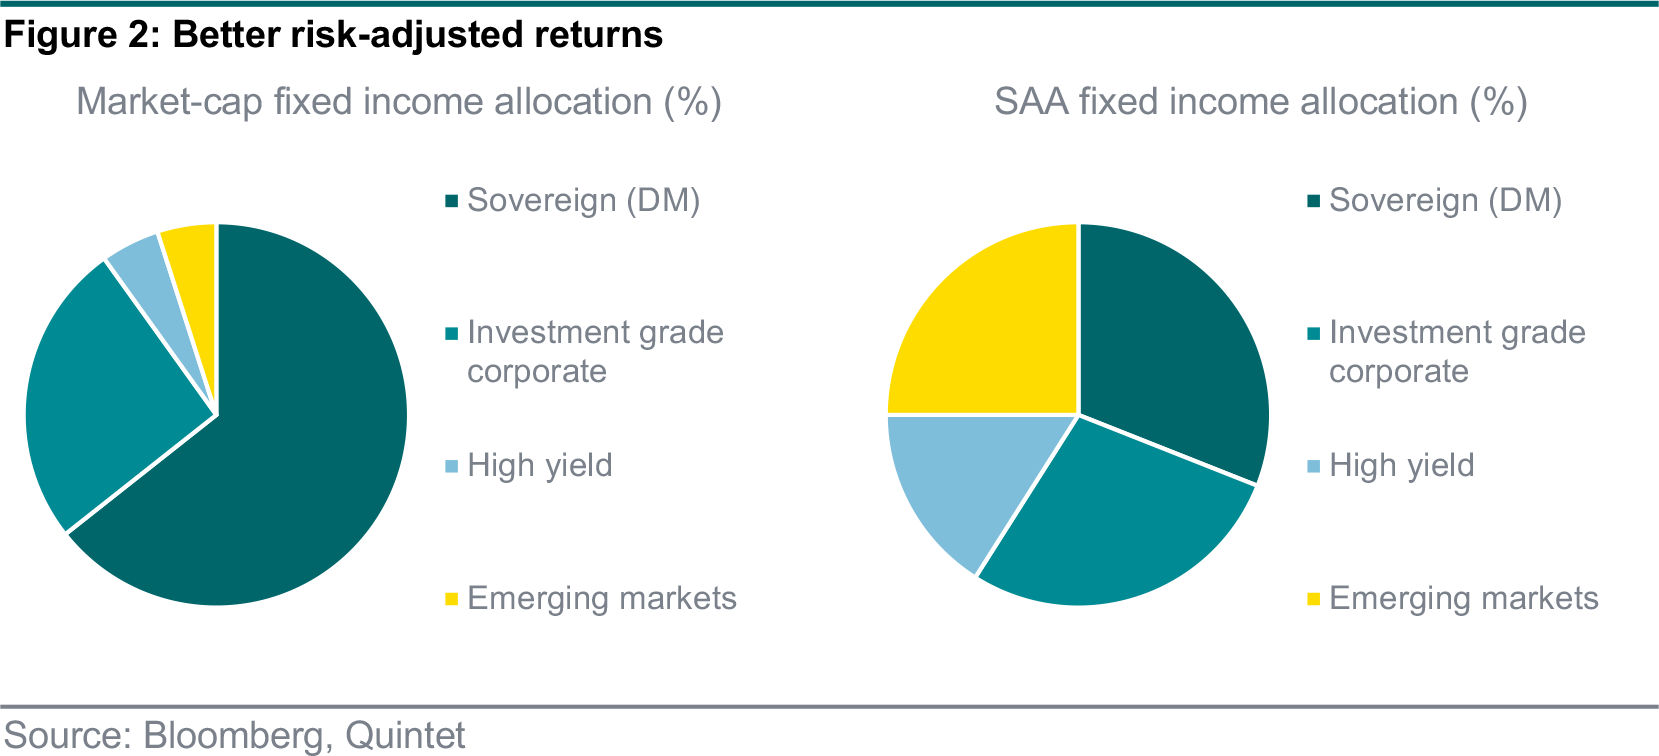
In short, to help you reach your financial goals. We define our SAAs with a single objective in mind – find the allocations with the highest expected return for a given level of risk. Going through the process described above allows us to construct portfolios with better risk-adjusted returns for each risk profile (figure 2). We achieve this by optimising allocations across different asset classes and deviating from simple market capitalization-weighted indices where our calculations tell us it is preferable.
In our current SAAs, we find that the best regional equity allocation is closely aligned to market-cap weights. Within fixed income, however, we overweight global credit and in particular high yield and emerging market (EM) bonds.
How often do we review our SAAs?
We review and update our SAAs annually. Our CMAs are long term in nature, roughly capturing a full business cycle. Because of the long-term horizon, they typically do not change dramatically from year to year.
Do we consider currency exposure in the SAAs?
The currency allocation in the SAAs is one result of this optimisation process and is defined independently of currency exposure of the underlying asset classes. Simply put, if the currency exposure of any given asset class improves a portfolio’s risk-adjusted returns, we keep it. If it doesn’t, we hedge the currency to the portfolio’s base currency. We find that within fixed income, currency risk is best fully hedged (except for EM local currency bonds). Within equities the hedging ratio varies across different regions and currencies.
Why is there such a high exposure to (EM) credit?
The higher allocation to credit (compared to a market-cap weighted index) boosts the expected returns on the fixed income section of our SAA profiles by a factor of two or more. With the higher allocation to credit come higher credit and liquidity risks than for government and high-quality corporate bonds. These risks are, however, well compensated for by the additional expected yield. They are fully incorporated into our risk and return expectations and hence the optimal SAA weights. By allocating to the full range of credit asset classes, including EM bonds in hard and local currencies, we seek to diversify our exposure across regions, yield curves, currencies and credit ratings.
Where do our return expectations come from?
The risk and return expectations in our capital market assumptions play a central role in constructing our optimal portfolios. Inherently, such financial projections are riddled with uncertainty. To improve their reliability, we have chosen a longer forecast horizon (10 years) and average results from different models rather than relying on the forecasts of just one model. This approach helps us lower the overall estimation error of our forecasts.
Specifically, in estimating expected returns, we combine a multi-asset factor model with asset class specific models (see box ‘SAA factor model: a primer’). The factor model helps us to reduce the number of time series we need to predict, and to obtain a set of forecasts across our large asset class universe that are consistent with one another (which is a difficult problem when forecasting models are completely unrelated).
Factor models are based on the idea that optimal long-term portfolios derive returns from many different and independent risk factors. The idea that there are risk premia beyond a pure ‘market factor’ that investors can capture relatively consistently is not a new one. It dates back to the work of Nobel laureate Robert C. Merton in the early 1970s. Its application in a multi-asset SAA context, however, is more recent.
In our approach to estimating long-term returns, we incorporate a multi-asset factor model. We don’t rely on the model entirely but blend it with asset class specific models. Our factor model makes it easier to obtain forecasts across our large asset class universe and, crucially, makes these forecasts more consistent with one another.
Which factors do we consider?
We identify the key drivers of our asset classes to be developed market (DM) equities, duration, EM equities, commodities and the US dollar. In our model, each of these factors is investible in its own right, and so we can directly translate expected returns on these factors into expected returns for each of our asset classes.
How do we estimate the factor returns?
All asset classes in our universe are regressed on the key factors we have identified. We use the maximum extent of data we have available to estimate the betas of the regression. These betas allow us to extrapolate asset class returns for our entire universe based on our return forecasts for the factors.
To get return forecasts for the DM equity factor, we use an empirical approach for estimating the equity risk premium (ERP) considering adjustments for survivorship bias. For the EM equities factor, we also rely on an empirical approach that looks at the historical excess return of EM equities over their DM counterparts. For duration, we rely on market spot rates, an estimate of the term premium and an assumption of how long it takes for the term premium to mean revert. Finally, the return estimate for our commodities factor is linked to inflation, while the US dollar factor returns are estimated by a blend of theoretical fair value models.
Which SAA profile is right for me?
The right SAA risk profile is the one that matches your risk tolerance and financial goals. Across our SAA risk profiles, the key determinant of risk and return is the equity allocation. A higher equity share means higher expected returns. Equities offer the best long-term return outlook in our universe. But they also tend to produce a bumpier ride with more setbacks along the way (figure 3).
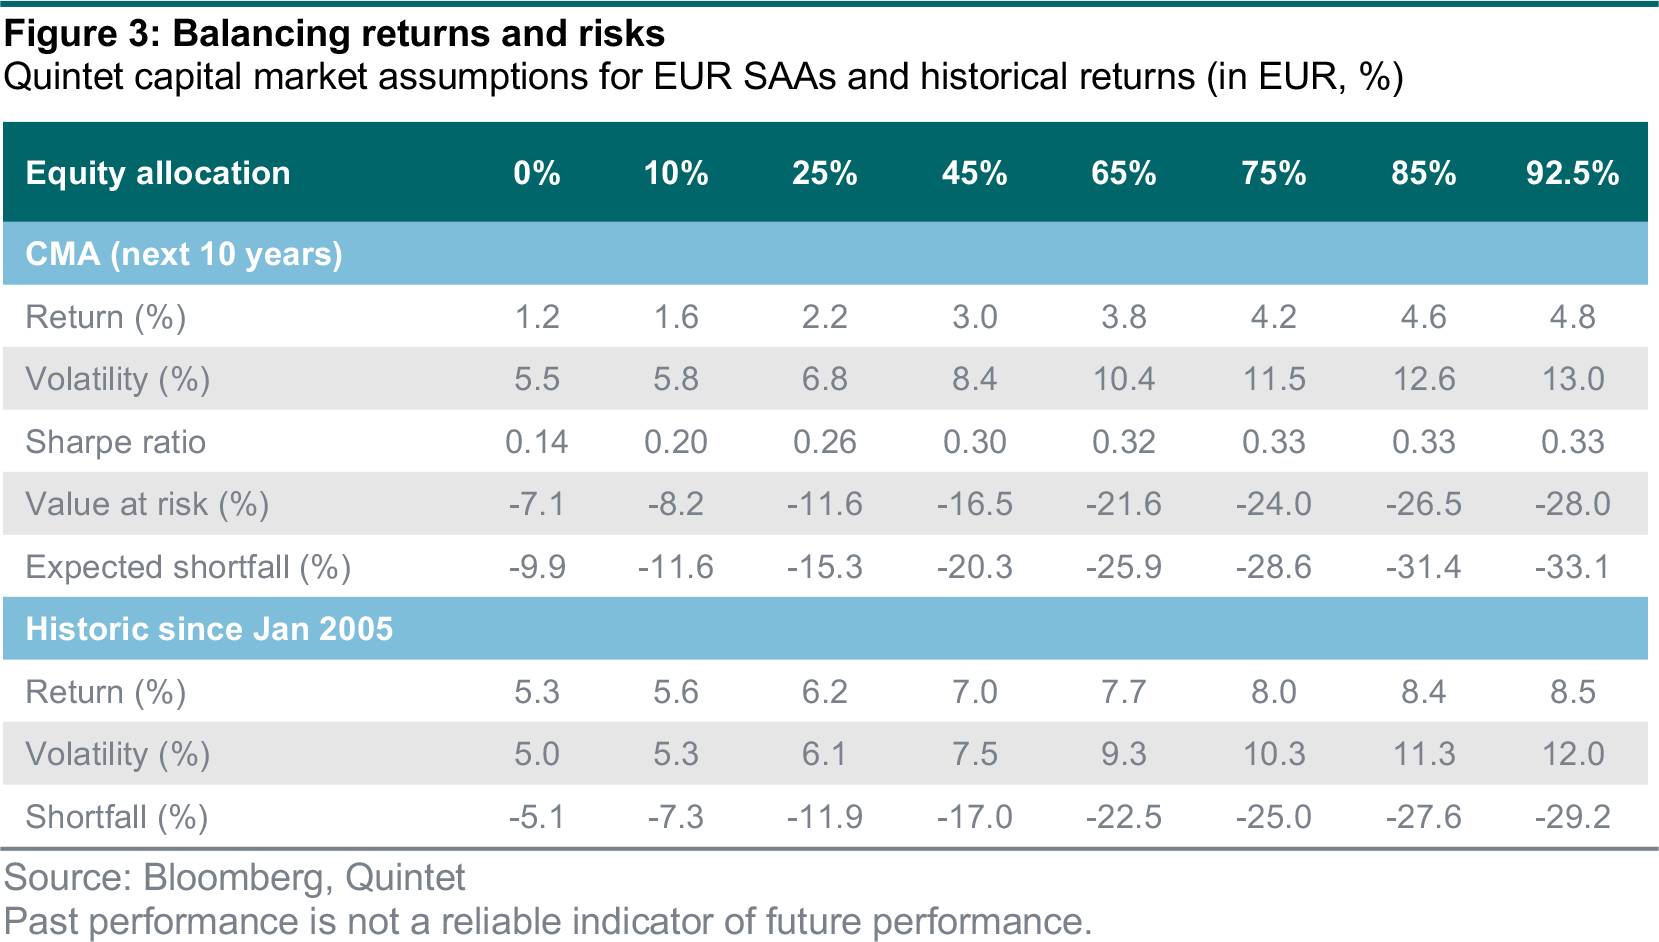
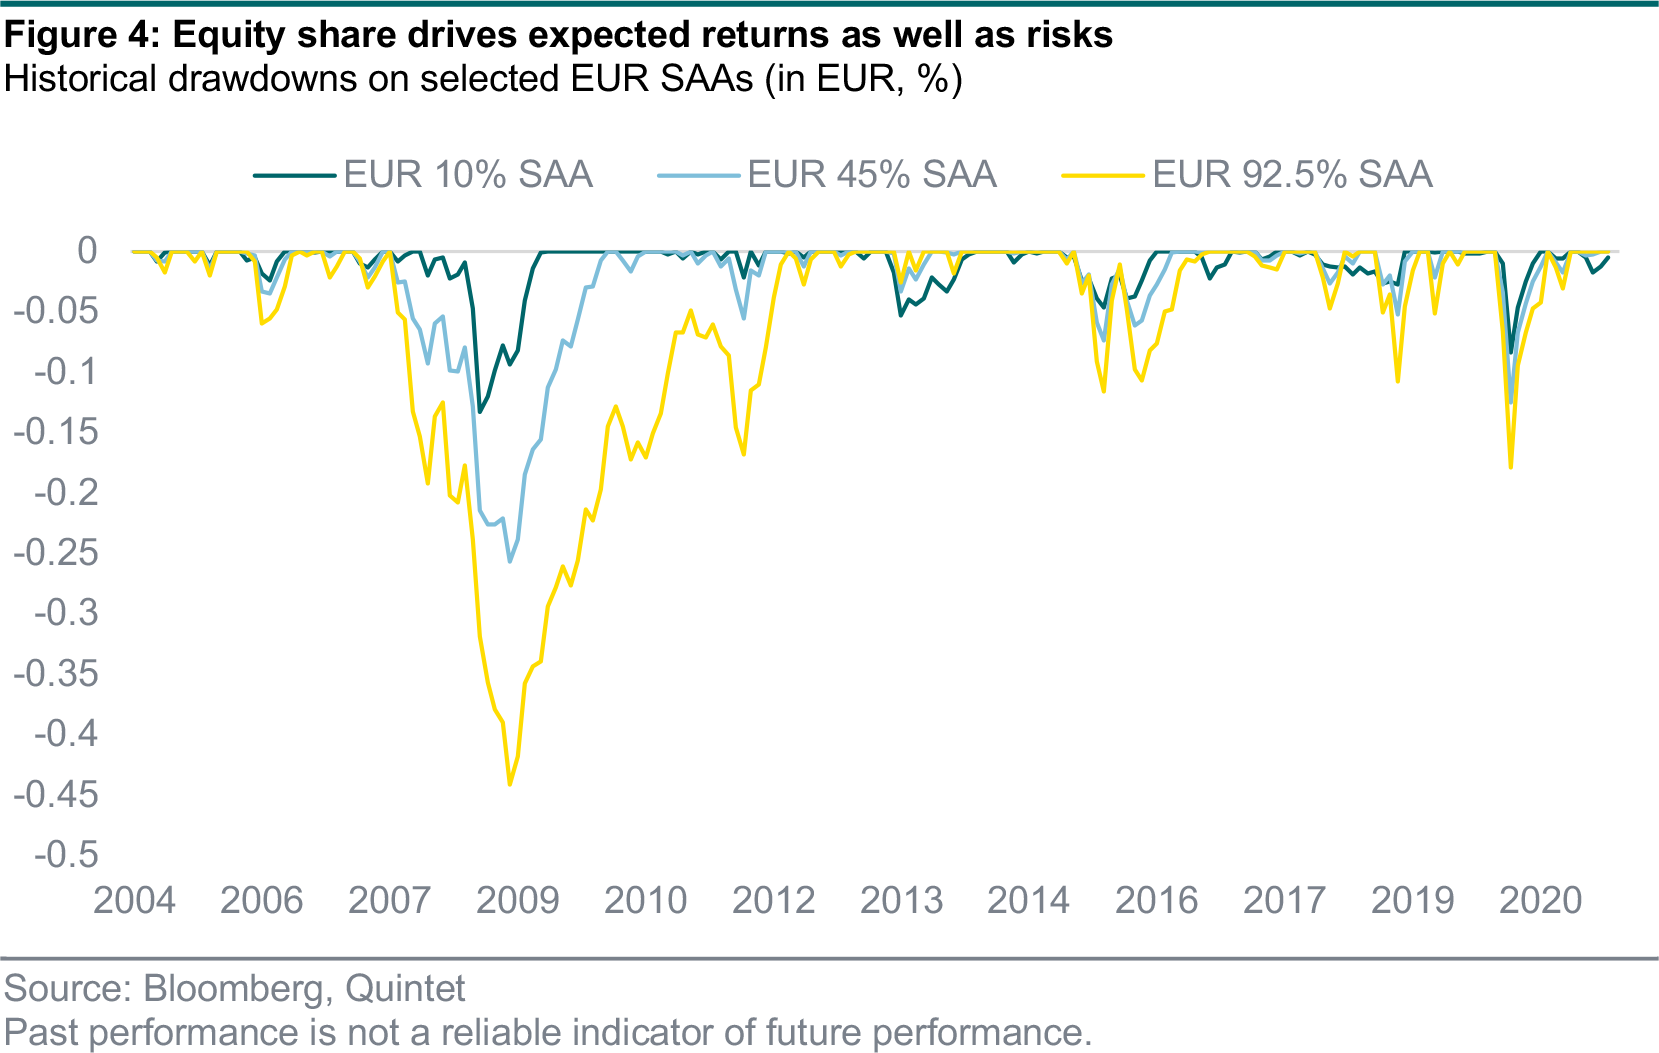
While we often refer to the 45% equity SAA as a reference point in our publications, it is just a reference, not a preference. In principle, long-term investors should have as much exposure to equities as they can accept from a risk perspective. Risk-adjusted returns are highest in the SAAs with equity exposure of 75% or more. Equities, however, tend to fall much more dramatically than ‘safer’ assets such as bonds during time of market stress (figure 4). For instance, a very conservative portfolio with only 10% allocated to equities lost 13% at the peak of the financial crisis (GFC) and 8% during the selloff last year. Meanwhile, a portfolio with a 92.5% equity share had a maximum drawdown of 44% in the GFC and 18% last year. The future expected shortfall for the former is 15% while it is 35% for the latter.
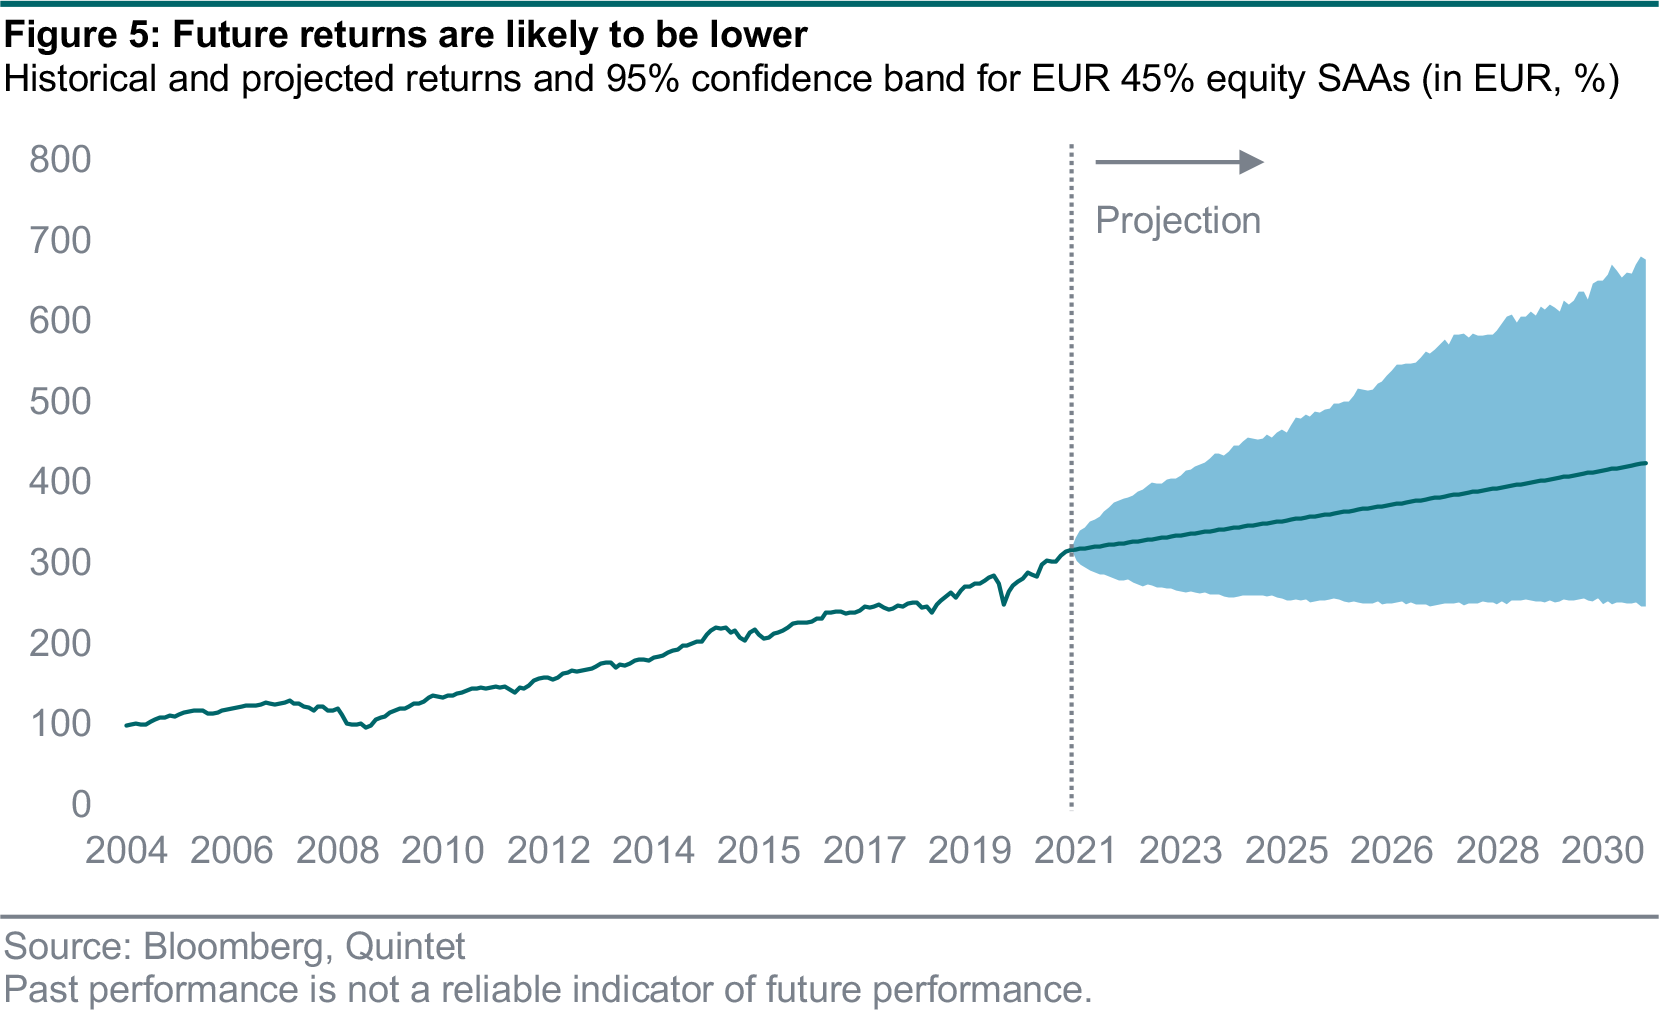
How do we address the low return environment?
Returns over the next 10 years are likely to be lower than in past decades (figure 5). We expect our 45% equity SAA portfolios in EUR to return 3% annually on average. Historically such a portfolio averaged 7% total return per year (since 2005). The low return expectations are more dramatic for fixed income heavy portfolios. We expect our EUR SAA with only 10% equity allocation to return 1.2% per year on average, only about a fifth of the average annual return since 2005. But we expect lower returns across all SAA risk profiles.
The lower future returns for our SAAs are not a result of how we construct our portfolios. Lower future returns are rather the result of low yields and high valuations. Our SAAs offer optimal risk-adjusted returns for each pre-identified risk profile. That means from an SAA construction point of view, the only way to enhance returns is to take on more risk. Short-term deviations from our SAAs through tactical asset allocation (TAA), careful selection of (sustainable) investment instruments and efficient implementation enhancing pure SAA returns are all key features of our investment process.
Clients with access to direct private investments and offshore hedge funds may capture additional returns through illiquidity premia. Our outlook for UCITS alternative funds on an index level is less enticing and they do not form part of our optimal core allocations. But we are working hard to continuously expand our alternatives and private markets offering.
How do you factor geopolitical risks into the SAA and sustainability assessments?
The SAAs are ‘brought to life’ by implementing asset classes in a sustainable way. So, for each asset class our ESG and product specialists look for a sustainable representation. Asset classes that are not investable in a sustainable manner, such as diversified commodities, are then typically excluded from our universe.
When considering geopolitical factors, we first distinguish between sovereigns and those companies headquartered, listed or operating in the respective countries – the financial risks and sustainability considerations tend to materially differ. Furthermore, as sustainable investors, we pay particular attention to geopolitical risk as we systematically incorporate the most important ESG factors in our analysis. We remain objective and are cognisant that our clients hold a range of personal views. Therefore, when utilizing ESG information, we seek to objectively understand the risks and opportunities and then incorporate them into our analysis.
Historically, jurisdictions where geopolitical risk considerations are more prominent have often faced larger and/or more unpredictable shocks than those where geopolitics is a lesser issue. An example of an unpredictable shock is political intervention in the economy or stock market, and while this sporadically occurs in all jurisdictions, it is more likely to occur in stock markets where geopolitical risks are heightened. Typically, equity investors respond to such risks by assigning lower valuation multiples to corporates operating in these jurisdictions. However, in many cases investors will also receive benefits. For example, several EMs exhibit faster economic growth and superior revenue growth than more developed markets. As part of our investment process, we therefore weigh both risk and opportunity and pay particular attention to the material ESG information. When risk/return is favourable, and having incorporated ESG considerations, we invest. When we judge that this isn’t the case, we proactively exclude such investments.
Conclusion
SAA forms the basis of our investment portfolios, and determines most of the risk and return. It defines a set of globally diversified portfolios that deliver long-term returns in line with individual risk appetites and return objectives. That is, it allows you to achieve the best returns with a level of risk you are comfortable with.
That becomes even more important in a world of lower expected future returns. Our SAAs offer optimal risk-adjusted returns for each pre-identified risk profile. That means from an SAA construction point of view, the only way to enhance returns is to take on more risk, if you are comfortable. Short-term deviations from our SAAs through TAA, careful selection of (sustainable) investment instruments and efficient implementation enhance pure SAA returns and are all key features of our investment process. Clients with access to direct private investments and offshore hedge funds may capture additional returns through illiquidity premia.
When we construct our optimal portfolios, we do so on a forward-looking basis. An integral step in deriving our optimal portfolios for each risk level is estimating future returns and risks rather than just extrapolating the past. We construct these forward-looking capital market assumptions with a 10-year horizon in mind and by relying on a range of models.
Finally, sustainability considerations are a key pillar of how we invest your money. As sustainable investors, we pay particular attention to geopolitical risk as we systematically incorporate the most important ESG factors in our analysis. We remain objective and are cognisant that our clients hold a range of personal views. Therefore, when utilizing ESG information, we seek to objectively understand the risks and opportunities and then incorporate them into our analysis.
Authors:
Carolina Moura-Alves Group Head of Asset Allocation
Patrik Ryff Strategic Asset Allocation Strategist
James Purcell Head ESG, Sustainable & Impact Investing
Philipp Schöttler Cross-Asset Strategist
Bill Street Group Chief Investment Officer
This document has been prepared by Quintet Private Bank (Europe) S.A. The statements and views expressed in this document – based upon information from sources believed to be reliable – are those of Quintet Private Bank (Europe) S.A. as of 30 August 2021, and are subject to change. This document is of a general nature and does not constitute legal, accounting, tax or investment advice. All investors should keep in mind that past performance is no indication of future performance, and that the value of investments may go up or down. Changes in exchange rates may also cause the value of underlying investments to go up or down.
Copyright © Quintet Private Bank (Europe) S.A. 2021. All rights reserved.