


The third piece in a series exploring our approach to strategic asset allocation takes a closer look at our expected evolution for eurozone government bond yields and the role they play in optimising the risk and return balance in well- diversified portfolios.
- We expect 10-year yields of government bonds in the eurozone to average a mere 0.8% over the next 10 years and have a total return expectation of close to zero pencilled in for the asset class.
- The reasons for these low yield forecasts are lower central bank rate expectations than in previous cycles and a lower term premium than in the past. These forces are driven by structurally lower growth potential and productivity and a weak demographic outlook.
- Despite low return expectations, eurozone government bonds play an important role in our optimal SAAs because they act as a diversifier. Given the low yield environment, we have complemented them with other diversifiers such as gold to optimise risk and return characteristics of the portfolios.
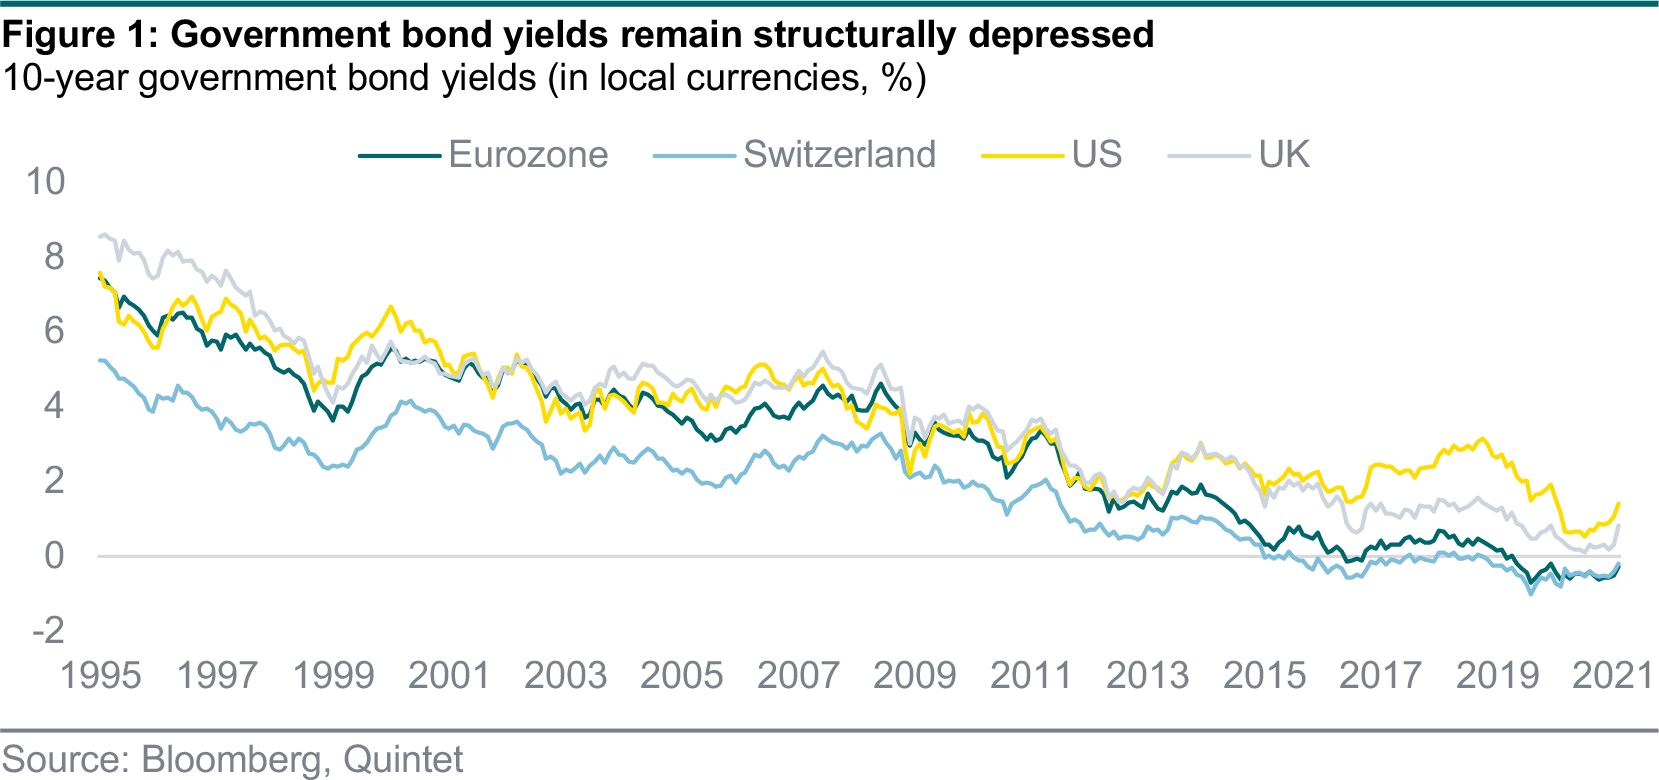
Yields on government bonds in the eurozone reached historic lows at the end of last year and remain structurally depressed (figure 1). Crucially for our strategic asset allocations (SAA), our return outlook for the asset class is also poor. In the capital market assumptions (CMA) underpinning our SAAs, we expect bond yields in the region to average only 0.8% over the next 10 years. We expect the yield curve to remain rather flat and estimate that the total return over the same horizon is barely above zero, lower than what we expect for cash. We also expect a total return of zero for CHF government bonds and, while we have slightly better return expectations for US Treasuries and UK Gilts, we see government bond returns underperforming cash in all our reference currencies.
Structurally low demand and a savings glut have propelled central banks’ policy rates lower and lower in each rate cycle. This is particularly the case in the eurozone, where potential growth is lower than in the US or in developing economies, productivity is chronically weak and demographic dynamics are challenging. In addition, the term premium – the amount investors expect to be compensated for lending for longer periods – has declined. It was systematically positive in the 70s, 80s and 90s because investors in nominal bonds demanded compensation for bearing inflation risk. However, since the 1990s, inflation has become less of a perceived risk by most investors, and so the premium they have demanded has decreased. Finally, after the Global Financial Crisis (GFC), it was deflation that many market participants in the West feared for the first time, and the term premium became negative.
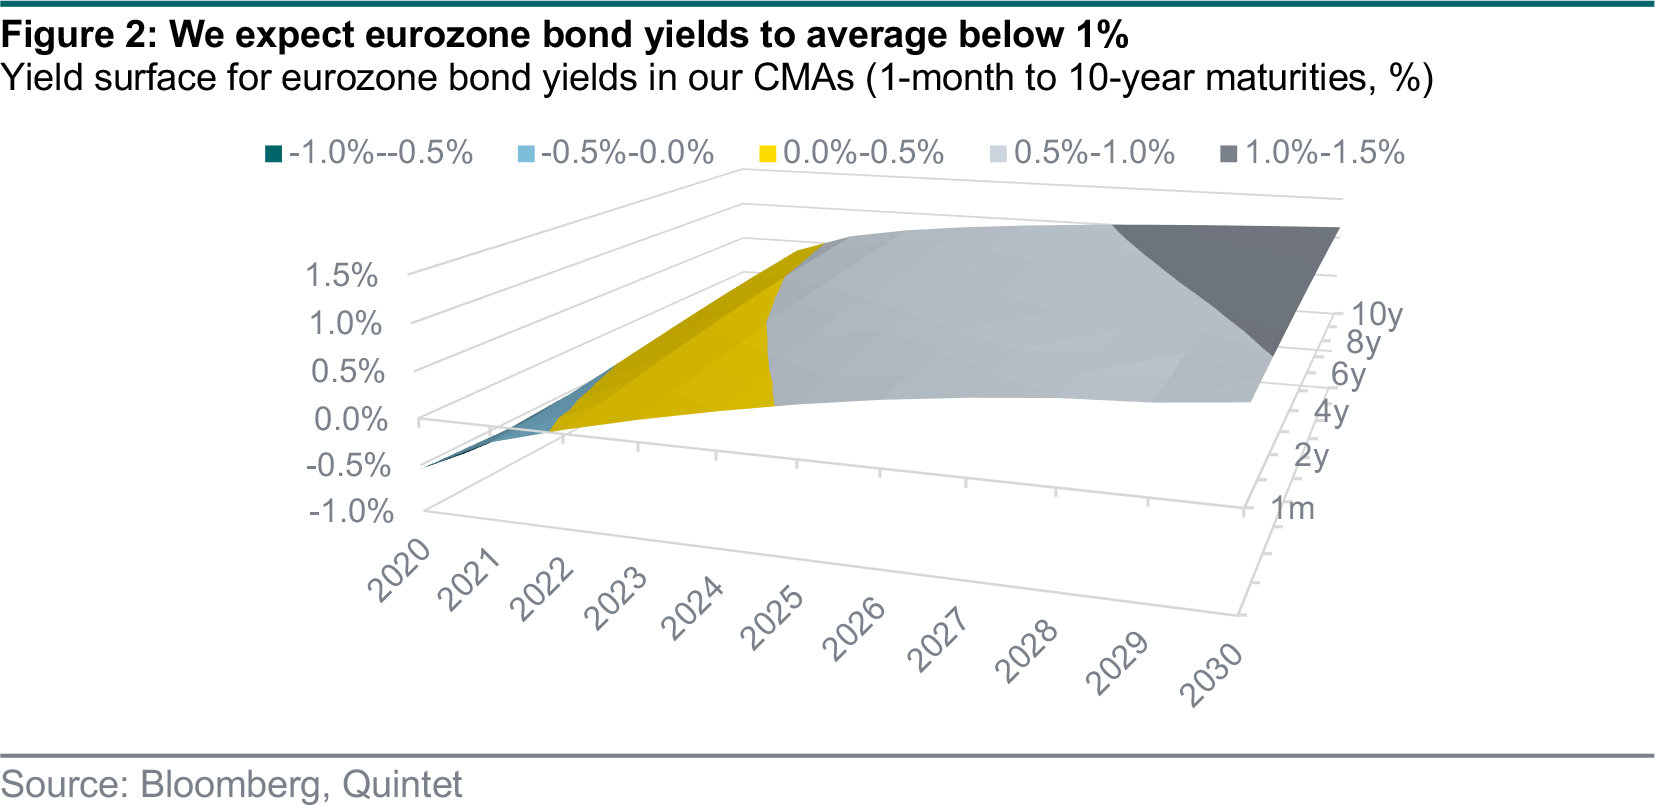
These trends are unlikely to revert in full anytime soon. Our return expectations for eurozone government bond yields, which take into account the information embedded in the current (spot) yield curve, reflect that (figure 2).
Our CMAs estimate the long-term (over 10 years) expected return and risk for each asset class in our universe by using a blend of factor and asset class-specific models.
When we estimate expected returns for government bonds, we begin by constructing our forecast for each regional yield curve (USD, EUR, etc). Once we have these yield curves, it is a mathematical exercise to simulate the returns that would be realised by rolling a bond of a target maturity according to the estimated yields.
To derive the yield curve forecast for a given currency (such as EUR), we follow these steps:
- We get market spot (zero) government bond yields from 1 month up to 20+ years.
- We obtain an estimate of the term premium. There are different approaches to estimate the term premium, all with their advantages and drawbacks. We rely on a blend of methodologies that are commonly used in academics and by investors.
- We form an assumption on the future evolution of the term premium.
- From the current market spot rates, our risk premia estimate, and our assumed path for the term premium, we generate a full yield curve of 1-month to 10-year tenors from today until the end of our investment horizon (10 years in the future).
- Given the yield curve, we simulate the returns that would accrue to a bond strategy with a fixed tenor by calculating the monthly strategy returns. This calculation is repeated each month to produce the returns over the forecast horizon to get the cumulative return.
Low or even negative yields pose a significant challenge to asset allocators. Over the last few decades, government bonds and other highly rated fixed income assets have generated a steady stream of relatively stable income as bond investors benefited from capital appreciation. In a portfolio context, government bonds also added ballast in times of market stress. But as yields are close to zero or negative, the room for a further rise in bond prices is more limited. In response, many investors have shifted out on the risk curve to reach their desired or required returns.
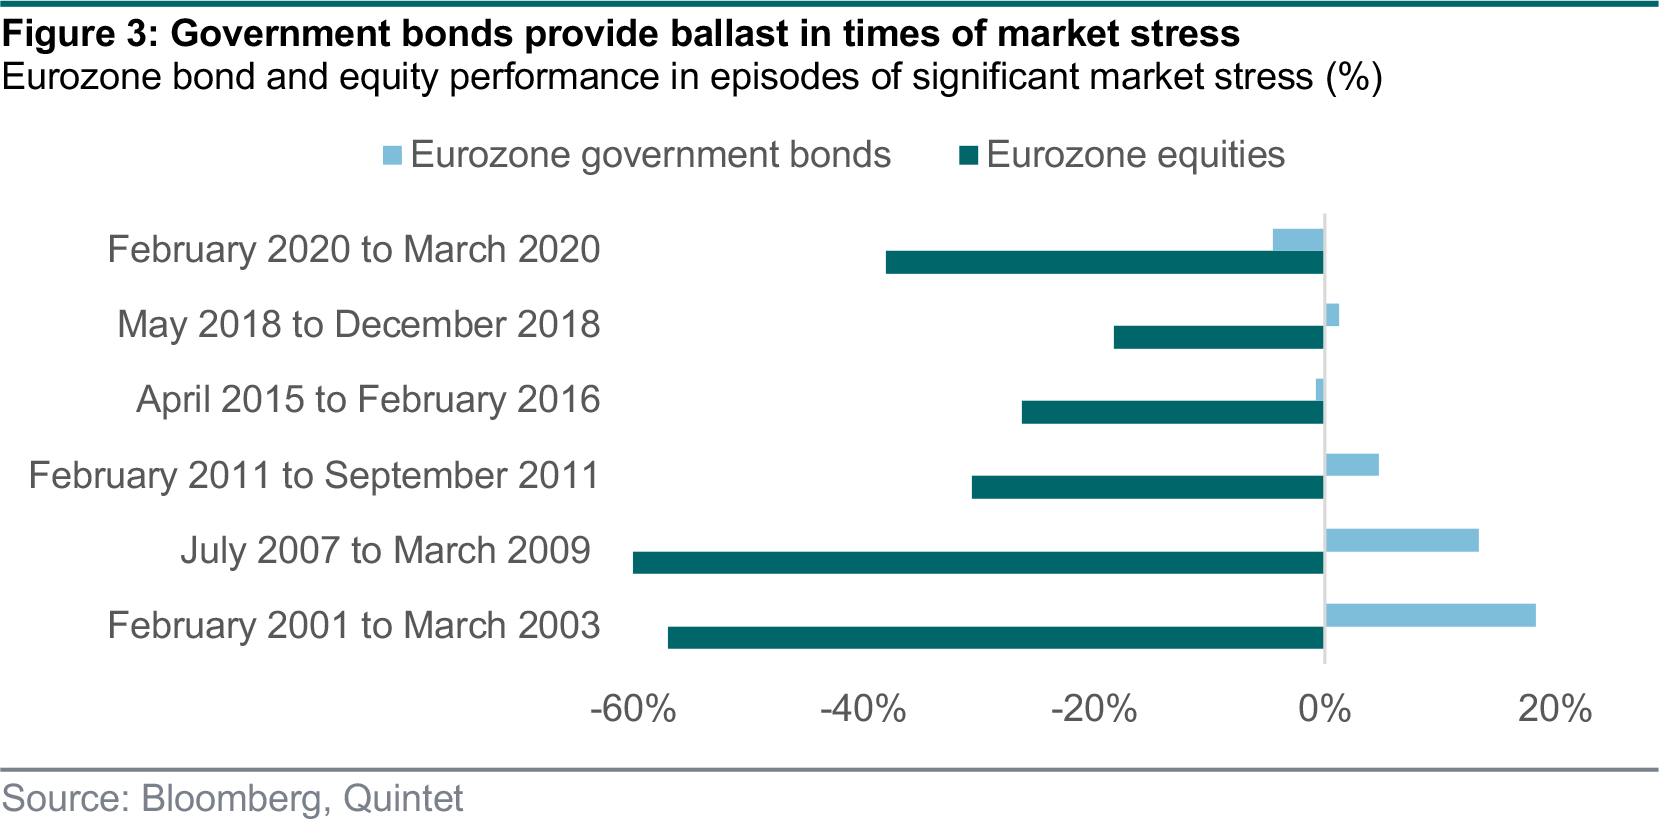
In our SAAs we are single-mindedly focused on achieving the best possible expected return for each risk profile, and the robust optimisation process behind that still includes a sizeable allocation to government debt. That is because despite the low yield and poor total return outlook, they still add diversification benefits. Their typically negative correlation with riskier assets in times of market stress make our portfolios more robust. Historically, highly rated government bonds have provided a safe haven for investors when risk assets sell off and we expect that to hold in the future (figure 3). We currently allocate 14% to government debt in our reference EUR SAA, of which 10% are eurozone government bonds.
Our SAAs acknowledge that while government bonds still act as a valuable diversifier, their ability to provide protection in future downturns may be lower. To compensate for that we have extended the set of diversifying assets in our quest for optimal portfolios. We have broadened our fixed income universe beyond highly rated bonds to include credit and reduced government bonds in our SAAs relative to market capitalisation. We have laid out our thinking behind that in a previous publication (Counterpoint Weekly 7–13 December 2020, ‘Expanding the credit universe’). We diversify our government bond allocation across regions and have included US inflation-protected government bonds across all four currencies. We have also added gold to our SAA universe.
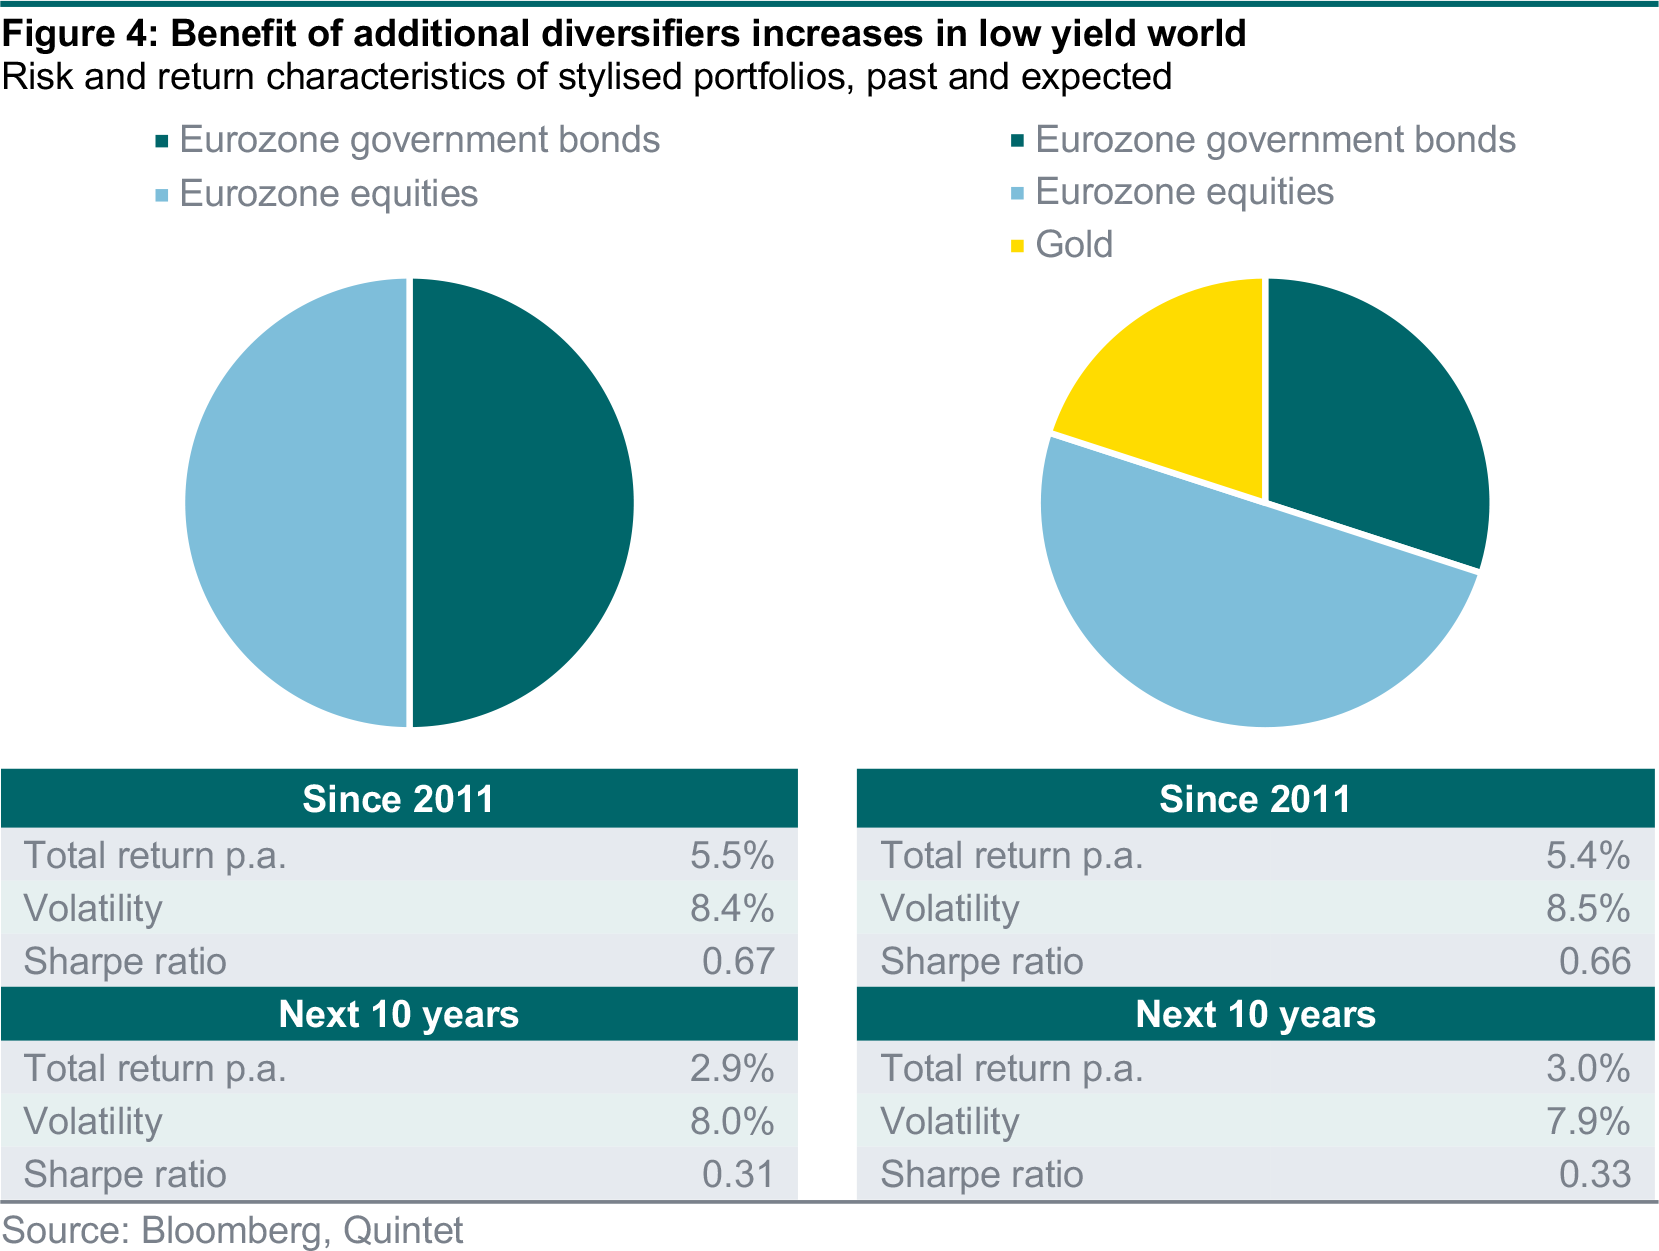
Gold typically has a relatively low correlation to both equities and bonds in the long term. The economic factors driving gold prices can be different form the drivers of other assets. Gold does not pay a regular coupon, but on the flip side also does not carry credit risk. It has a close link to inflation and real (inflation adjusted) yields. These characteristics make an allocation to gold attractive in a world where we expect yields to remain low and government debt to yield poor returns, despite a relatively low Sharpe ratio for the asset class on its own (figure 4).
Conclusion
We define our SAAs with a single objective in mind — find the allocations with the highest expected return for a given level of risk. Government bonds, including those in the eurozone, continue to act as diversifiers and play an important role in finding the most efficient portfolios from a risk-adjusted return perspective. In today’s low-yield environment, we expand our set of diversifiers to deliver for our clients.
Global Covid-19 infections surpassed 115 million, with fatalities exceeding 2.5 million. In both Europe and the US, the rate of daily new infections has been stagnating at around 20 per 100,000 people for over a week. Both regions are at the same point as six months ago. Most recently, however, the UK reported a further decline in new infection numbers, reaching a seven-day average of 12 per 100,000 inhabitants – even lower than in October. This trend was helped by the increasing vaccination readiness of the UK, where over 30% of the population have now been inoculated at least once. The UK has already distributed 20 million vaccine doses, making it one of the leading countries rolling out its vaccination effort. The US is also moving forward with its programme, with 15.5% of the population vaccinated at least once and 80.5 million doses already distributed. Things are slower in the EU, however, with only 5% vaccinated so far and an acceleration of vaccinations only likely in a few weeks. The goal is to vaccinate 50% of the European population by mid-summer, while President Biden aims to reach this level for all US adults by the end of May.
But new infections remain a problem, and not just in the US. While on the Iberian panhandle new cases are decreasing again, the EU’s average is still being pulled upwards mainly by its biggest three countries – France, Germany and Italy – and the Czech Republic (which is currently reporting more than 110 new cases per 100,000 inhabitants). The further spread of Covid-19 is also supported by several virus mutations. The UK variant is spreading rapidly in mainland Europe and the UK is also facing further new mutations – including the Brazilian variant, which appears to be twice as contagious as the conventional variant.
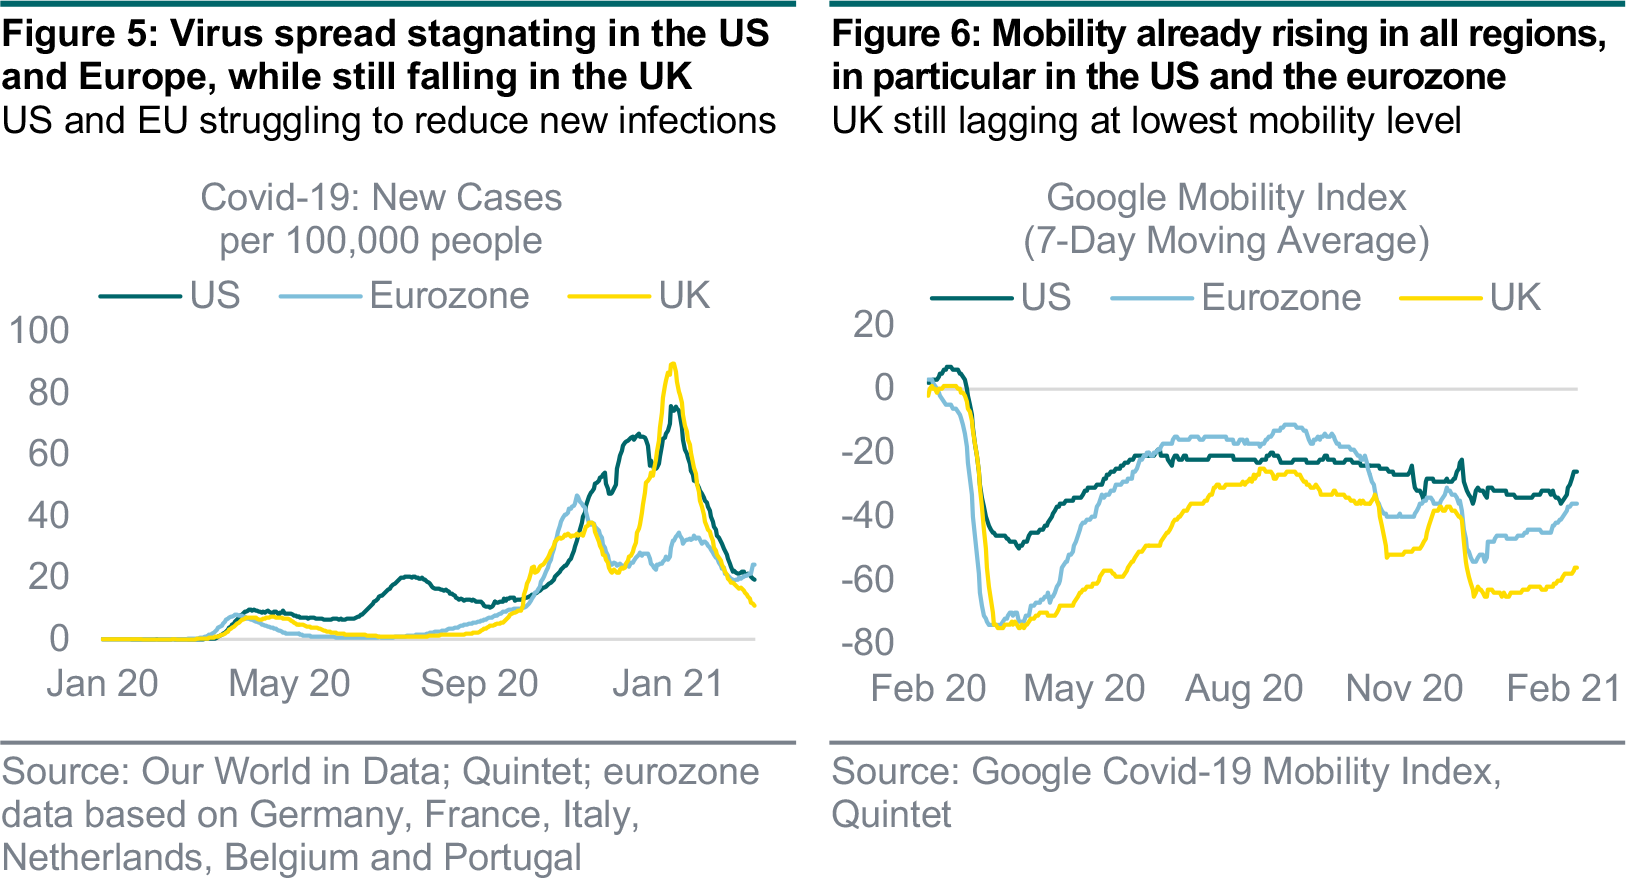
The number of new infections is directly related to the activity of the population: Google’s Mobility Index shows a sharp drop in all three regions at the turn of the year, going hand-in-hand with rising new infections and hard lockdowns. Only a month ago, mobility was at its second lowest level since the start of the pandemic. This level has been mostly maintained in the UK, while activity in the US and Europe has started to rise despite ongoing lockdowns, which helps explain new infection trends. With this obvious relationship in mind, most countries are hesitant to relax lockdown measures. Both the UK and Germany have decided to slowly step back to normality based on reopening plans, while measures in France and Italy are tightening further. While European countries are progressing at different rates, several US states are considering faster relaxations, with Pennsylvania and Texas being the latest to lift travel restrictions and occupancy limits.
Authors:
Carolina Moura-Alves Group Head of Asset Allocation
Patrik Ryff Strategic Asset Allocation Strategist, Group Chief Investment Office
Philipp Schöttler Cross-Asset Strategist, Group Chief Investment Office
Daniele Antonucci Chief Economist & Macro Strategist
Bill Street Group Chief Investment Officer
This document has been prepared by Quintet Private Bank (Europe) S.A. The statements and views expressed in this document – based upon information from sources believed to be reliable – are those of Quintet Private Bank (Europe) S.A. as of 8 March 2021, and are subject to change. This document is of a general nature and does not constitute legal, accounting, tax or investment advice. All investors should keep in mind that past performance is no indication of future performance, and that the value of investments may go up or down. Changes in exchange rates may also cause the value of underlying investments to go up or down.
Copyright © Quintet Private Bank (Europe) S.A. 2021. All rights reserved.