


Capital at risk
In the fourth piece in a series exploring our approach to strategic asset allocation (SAA), we look at what our capital market assumptions tell us about recovering losses when things don’t go as planned and why history is a useful but imperfect guide to the future.
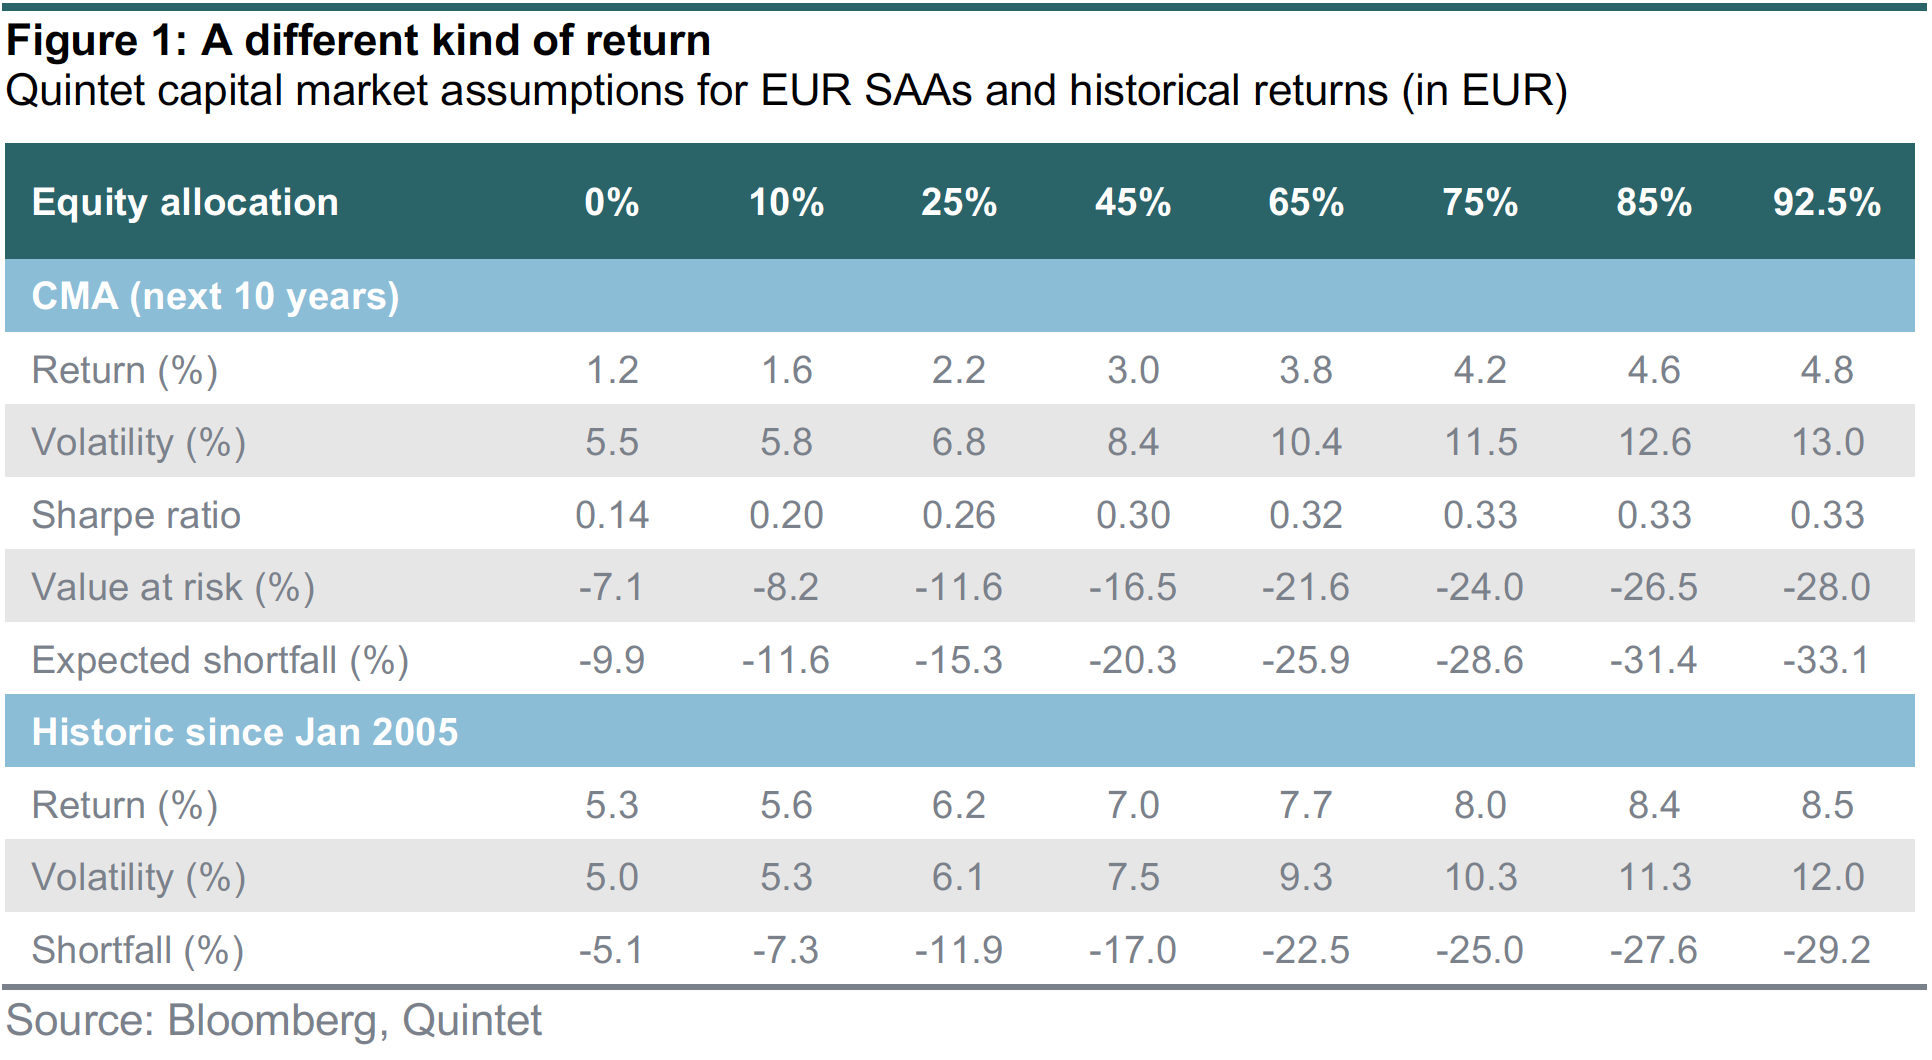
- We expect the returns of our efficient SAAs to be lower over the next 10 years than over the last decade. The volatility of our SAAs – our key measure of portfolio risk – should mostly be similar or even higher. That has consequences for another risk consideration: the risk of capital loss and how long it takes to recoup losses when they happen.
- Lower expected returns mean there’s a greater chance of losing money when investing today than in the past and it may take longer to recover any losses. That’s not a feature of how we construct our SAAs but a result of the return environment we foresee in our capital market assumptions.
- But that’s not all. The brave new world of investing also means that portfolios usually perceived as very ‘safe’ may have longer recovery periods than more ‘aggressive’ ones. Clients invested in the most conservative of our SAAs may face an inherent trade-off between how much fluctuation in value they can tolerate and how long they are willing to wait to recoup money lost when things don’t go as planned.
Capital at risk – the ubiquitous small print on any piece of investment advice has become all too familiar. But it is an important consideration, and the risk of capital loss has gone up in a world of lower expected returns. Investors are now facing a higher likelihood that they could lose some of their invested money than they did in the past. And when things don’t go as planned, it may take longer to recover these losses. That is not a feature of how we construct our optimal SAAs but rather the result of our return expectations and how volatile we think these returns will be – such is the brave new world of investing.
However, there is more to the story. Because the outlook is particularly weak for bond yields, portfolios with a high share of fixed income assets that are usually perceived as ‘safer’ because of their lower volatility may now take longer to recover from losses than somewhat ‘riskier’ portfolios. For some of our most conservative SAAs (i.e. those with a high allocation to fixed income), clients may face an inherent trade-off between two different types of risk: how much the value of their investment fluctuates over time and how long it may take to recover any losses when they happen.
When lower returns mean higher risks
Our capital market assumptions (CMA) are our best estimate of the long-term (over 10 years) expected return and risk – defined as the volatility of returns – for each asset class in our universe. They are forward looking by nature, and we use a blend of factor and asset class-specific models to generate them. Crucially, the returns we expect in our CMAs are significantly lower than over the past decade (figure 1). That’s a result of structurally lower bond yields than in past decades, rather than our way of constructing our SAAs. It has consequences, not just for how we structure efficient portfolios (see also Counterpoint Weekly 8–14 March 2021, ‘Optimal portfolios in a low yield world’) but also for the risk of loss of capital and the time to recover from drawdowns.
When we think about a world of lower returns and what it means for the risks our clients face, we like to do so in a forward-looking manner. While we know what happened in the past, what happens in the future is more uncertain. That’s why we simulate different possible scenarios for our SAAs going forward using a tool called Monte Carlo simulations, named after the popular casino destination in Monaco (see box ‘The Monte Carlo method: simulating the future’). Our analysis shows that the likelihood of loss of capital is higher than in the past – and the time to recover these losses when a drawdown happens is longer than in the past.
While we know what happened in the past, the future is inherently uncertain. When faced with such uncertainty, it can be preferable to think about a wide range of possible outcomes rather than making a specific forecast. The Monte Carlo method is a mathematical tool to do just that. It is a (stochastic) model used to predict the probability of different possible future outcomes.
How do we simulate different possible outcomes for our SAAs?
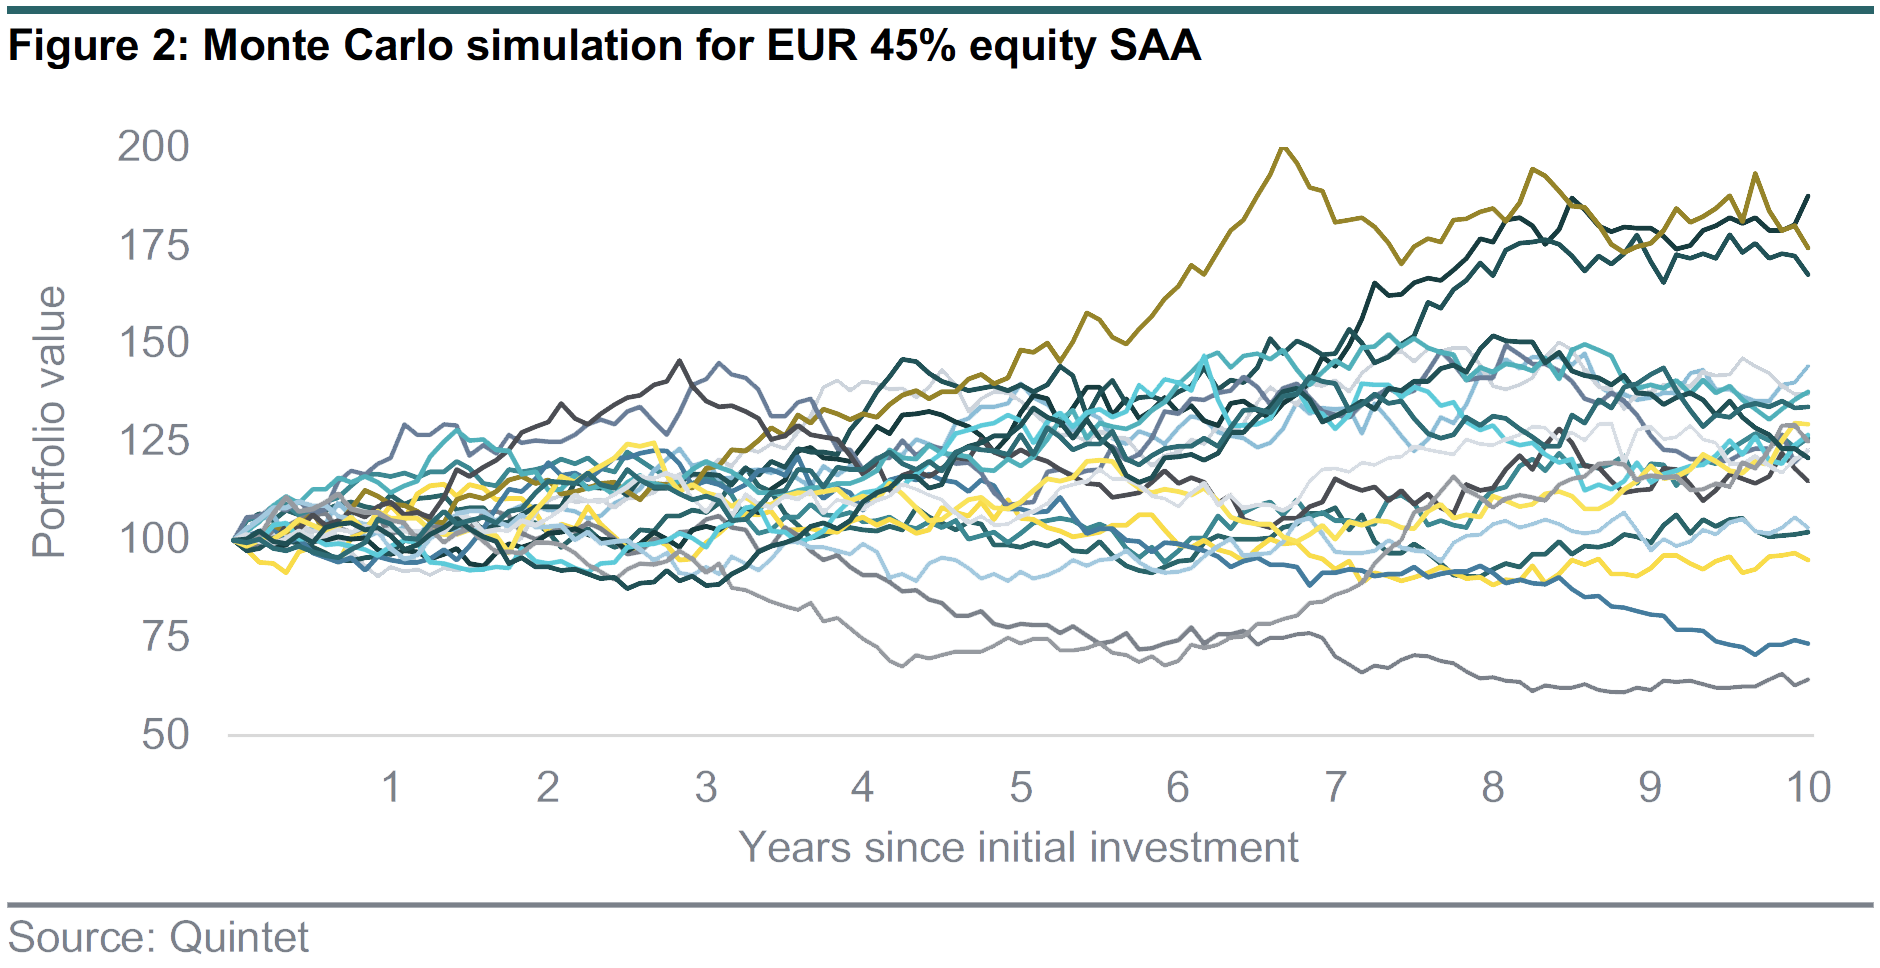
A portfolio’s value next month is equal to its value this month plus the return it generates next month. We don’t know yet what next month’s return will be, but we have an expectation about that return and its volatility from our capital market assumptions. The Monte Carlo simulation takes the portfolio’s expected return and volatility as a starting point and each year adds a shock. That shock depends on the expected volatility of the portfolio and a random variable (which we assume follows a normal distribution). The value of the portfolio is determined by the following formula:

We can generate a possible future path for the portfolio by calculating its value for each month over our 10-year horizon following that logic. By repeating this process 1,000 times, we get a wide range of possible future paths for the portfolio. Figure 2 shows the result based on a small subsample of our 1,000 simulations.
How do we calculate the probability of loss of capital from the Monte Carlos simulations?
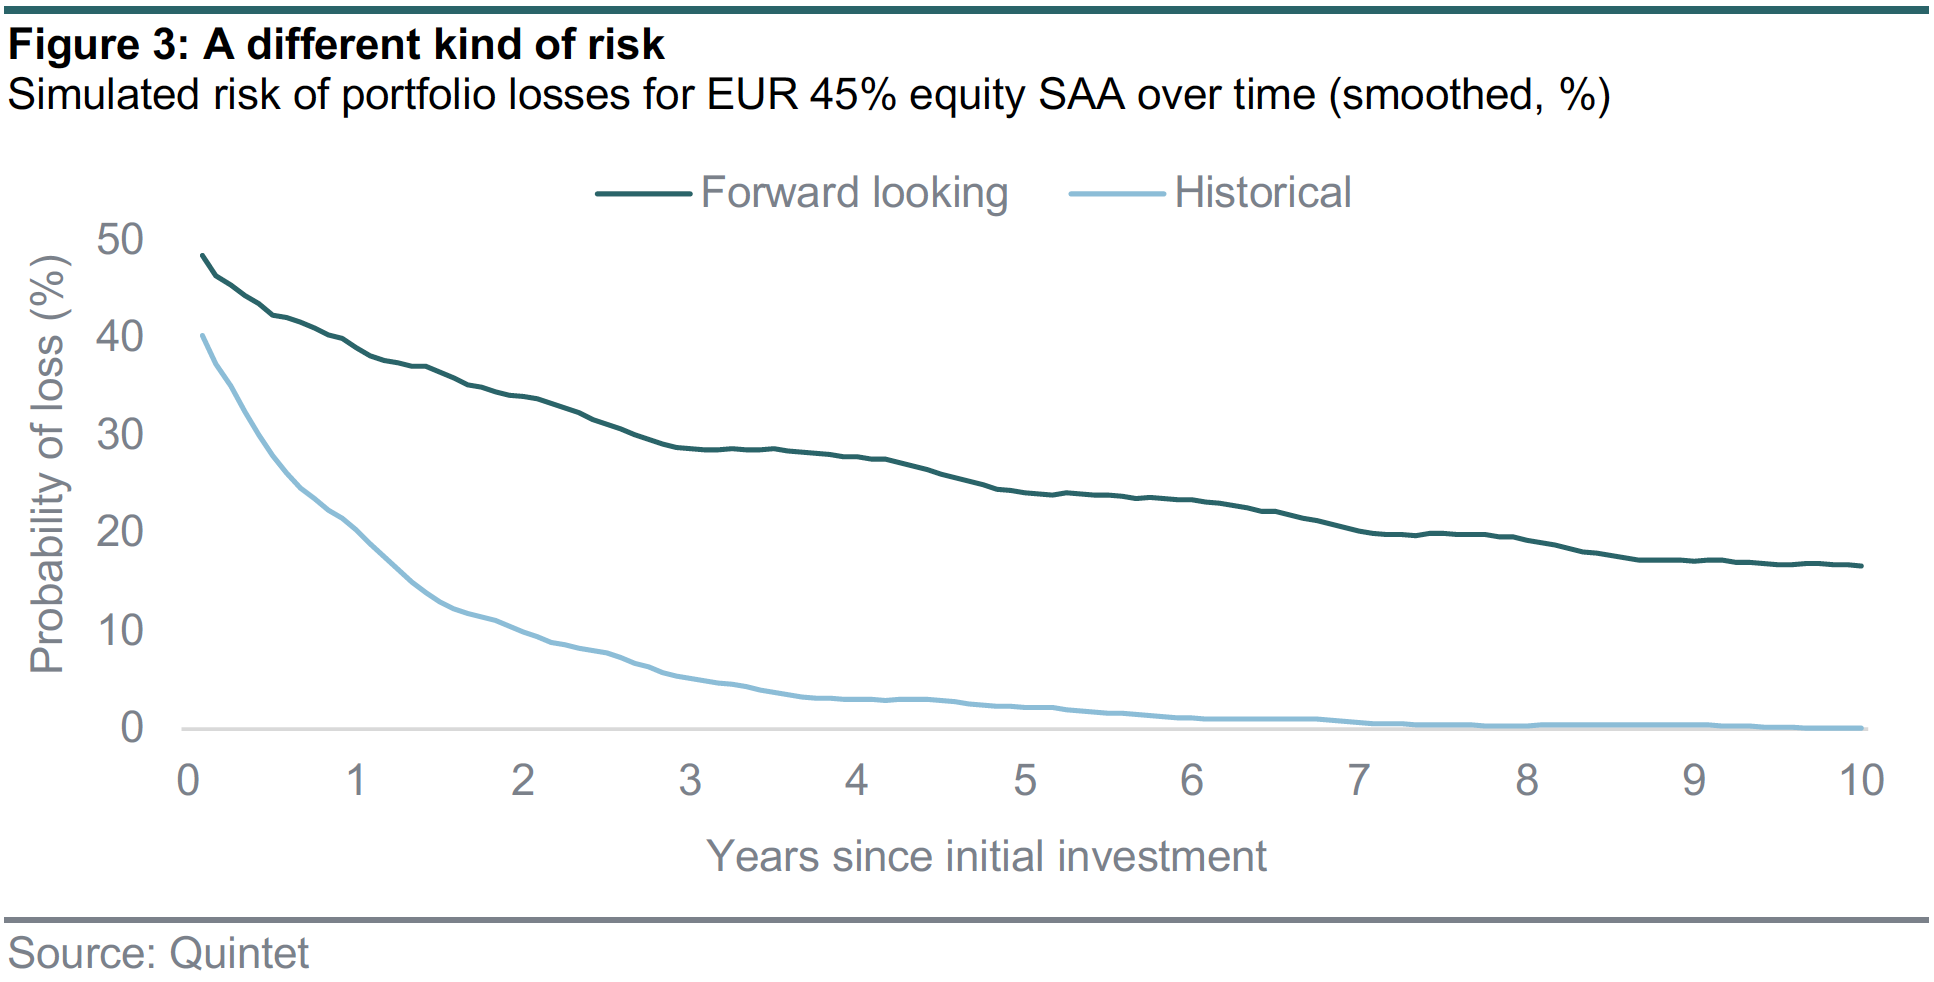
The 1,000 simulation runs give us a distribution of possible outcomes for the portfolio at each point in time. From that it is a straightforward exercise to calculate the probability of loss by counting how many of the randomly generated paths are below the portfolio’s starting value.
Figure 3 shows this result for one of our SAA profiles. We calculate the likelihood that a loss occurs for our reference EUR 45% equity SAA and plot it against time passed since the investment was made for two different simulations: one using our forward-looking return and volatility assumption, and one using historical return and volatility since 2005 as shown in figure 1. The contrast is stark. A client invested in our EUR 45% equity SAA could have reasonably expected the likelihood of losing some of their invested capital to be fairly close to zero after about three years. Going forward, that same client faces a chance of nearly one in three that they may lose some of their invested money after three years.
When risk isn’t equal to risk
But that’s not all. Our simulations highlight another feature resulting from the new environment investors are facing. Lower volatility doesn’t necessarily mean lower risk. At least not lower risk of capital loss. In fact, the risk of capital loss is now likely to be higher for portfolios with a very high share of fixed income that we usually think of as ‘safer’ because they tend to be less volatile and have lower expected drawdowns.
That may sound counterintuitive. In a way it is because in the past lower volatility, lower drawdowns and a lower risk of capital loss have all gone hand in hand. An investor holding a fixed income portfolio with relatively low volatility typically recovered more quickly from adverse shocks than someone invested in a higher-volatility equity portfolio. But ultra-low yields make it difficult to make back any losses quickly. Take eurozone government bonds as an example. A bond investor will have suffered a 2.5% loss on their eurozone government exposure year-to-date. Before 2013, when yields were 2% or higher, it would have taken a year or less for the yield to make up such a loss. Now, however, yields are about zero or even slightly negative. That makes it impossible to recover the loss via yield anytime soon.
Figure 4 makes that point. We again calculate the likelihood of capital loss and plot it against time that has passed since the initial investment was made. This time we only show forward-looking simulations for three different portfolios: our EUR 10% equity SAA, our reference EUR 45% equity SAA and our EUR 75% equity SAA.
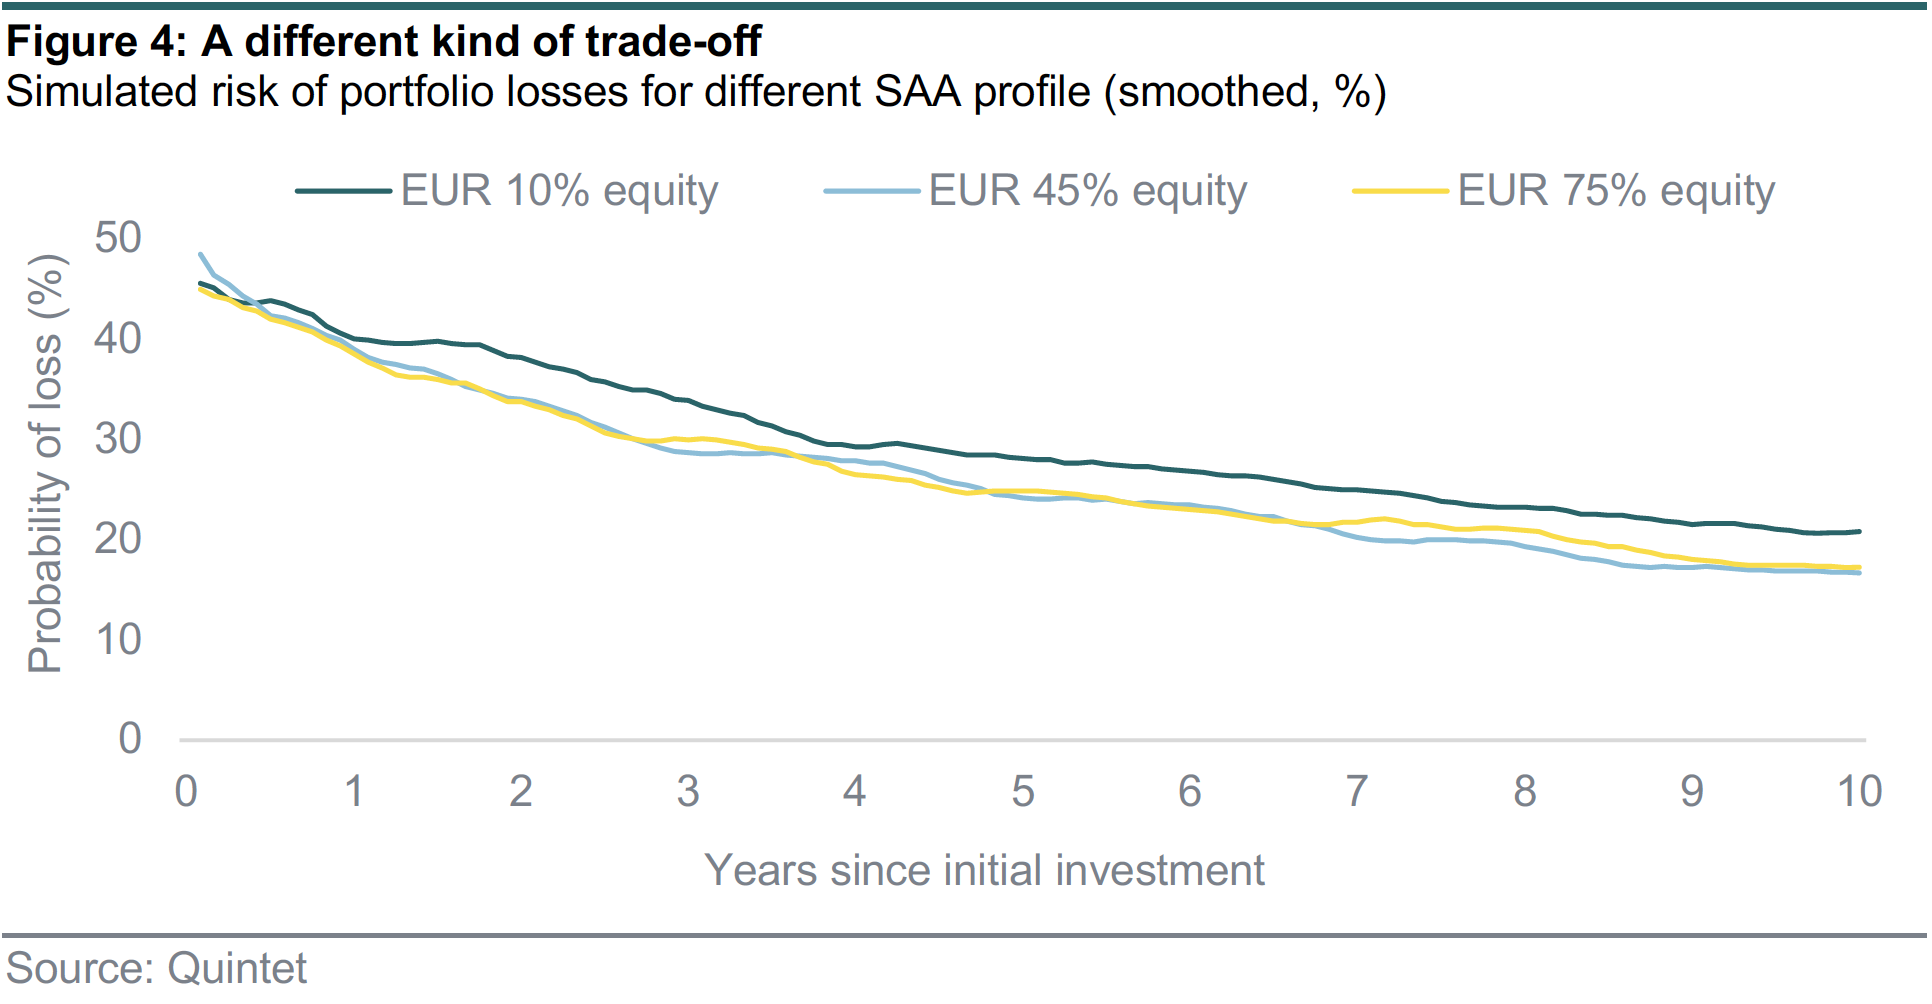
This highlights a surprising fact. For our most conservative SAAs, there may be an inherent tradeoff between different risks. How much the portfolio fluctuates and how deep a loss it may have on the one hand, and how likely it is that a loss occurs and how long it may take to recover from it on the other hand.
When the future isn’t the same as the past
The analysis highlights another fact. While history is often a helpful guide to the future, it is an imperfect one. It pays off to stay on top of things when changes in financial markets render longheld conceptions moot. That is not to say we can’t learn from history and exploit the patterns of the past. In fact, in many instances we do. But to provide our clients with the best advice possible, we must challenge our own preconceptions and allow for the occasional counterpoint to long-held preconceptions. And we do.
Conclusion
In previous Counterpoints, we have touched on how we construct optimal SAAs in the face of low yields. In this edition, we highlighted another consequence of that low yield environment. Maybe not so surprisingly, it means that there is a greater chance of losing money when investing today than in the past and it may take longer to recover any losses. More surprisingly, though, it also means that portfolios that we tend to think of as ‘safer’ because of their lower volatility may now take longer to recoup losses than more ‘aggressive’ ones, presenting a trade-off between different types of risks our clients face.
Authors:
Carolina Moura-Alves Group Head of Asset Allocation
Patrik Ryff Strategic Asset Allocation Strategist, Group Chief Investment Office
Philipp Schöttler Cross-Asset Strategist, Group Chief Investment Office
Liu Zihan Portfolio manager, Quantitative Strategies
Bill Street Group Chief Investment Officer
This document has been prepared by Quintet Private Bank (Europe) S.A. The statements and views expressed in this document – based upon information from sources believed to be reliable – are those of Quintet Private Bank (Europe) S.A. as of 12 April 2021, and are subject to change. This document is of a general nature and does not constitute legal, accounting, tax or investment advice. All investors should keep in mind that past performance is no indication of future performance, and that the value of investments may go up or down. Changes in exchange rates may also cause the value of underlying investments to go up or down.
Copyright © Quintet Private Bank (Europe) S.A. 2021. All rights reserved.